Update on what happened in WebKit in the week from June 30 to July 13.
The summer continues with many updates to the new SVG engine (LBSE),
improvements to the new Skia-based compositor, some small API additions,
and ever-important stable releases with security fixes.
Roughly halved the cost of the Skia based
compositor on WPE running on Vivante
GPUs with the Etnaviv driver, by turning off Skia's mipmap sharpening option.
That option is enabled by default and makes the Skia shader generator append a
small negative level-of-detail (LOD) bias to every mipmap-capable texture
sample. WPE does not use mipmapping at all, so the bias sharpened nothing,
but it still turned each texture fetch into a LOD lookup, which is a slow path
on the tiled GPUs found in the i.MX series. Disabling it restores usage of
faster, plain fetch operations.
Fixed broken rendering with the Skia
compositor on WPE when super-tiled
textures are enabled on Vivante GPUs. Those tile buffers are allocated padded
up to a multiple of 64 pixels, so the physical texture is larger than the
logical tile, but the Skia backing failed to take this difference into
account, leading to distorted tile images being rendered.
Stopped the Skia compositor from blending opaque
layers on WPE. Every layer was drawn
with the default source-over blend mode, which leaves GPU blending switched on
even for fully opaque layers that do not need it, so the cost was paid on
every composited frame.
Layers that are opaque, drawn at full opacity and using the default blend mode
are now composited with a plain source blend mode instead, which lets Skia
turn blending off and lowers GPU bandwidth usage, benefiting tiled GPUs the
most.
Reading the transform attribute walked the whole transform list and
multiplied every item together again, and that happened around three times per
animation frame for each element, even though the result only changes when the
transform list itself is mutated.
The concatenated matrix is now stored on the element and invalidated whenever
a transform-related attribute changes, so the multiplication runs once per
mutation instead of once per read. This cuts repeated matrix work out of the
per-frame path for animated SVG content.
Painting a container used to set up a clip rectangle for every child shape in
turn, so each shape did its own graphics-context save, clip and restore even
though the clip rectangle was identical for all of them. When there is a
single region to clip to and no child paints into its own layer, that clip is
now established once and shared by every child, transformed or not.
This removes a per-shape save and clip from the hot painting path of SVG
documents with many children.
Every transform flush recomputed the origin for each non-layered SVG shape,
even though it only depends on the transform-origin style and the transform
reference box, and sampling MotionMark's Suits test at fixed complexity showed
that computation taking around 1% of the WebProcess main thread.
The origin is now cached and keyed on the reference box, with a style change
to transform-origin or transform-box dropping the cache, and the fast path
is limited to plain SVG transforms so viewport containers and CSS-transformed
renderers keep computing it directly. This removes a repeated per-shape cost
from animated SVG content, and the caching scope can be widened later.
The default transform-box for SVG is view-box, so every transformed shape
resolved the viewport from the SVG root's content box again on each query,
both when updating its local transform and again during paint. The viewport is
constant after layout, so it is now cached on the <svg> element and only
recomputed when layout actually changes it, on resize, zoom or a viewBox
update. This removes another repeated per-frame computation from the transform
path for animated SVG content.
Once per rendering update WebKit processes every SVG renderer whose transform
changed, whether from script or an animation, and that repaint pass was the
dominant per-frame cost on MotionMark's Suits subtest. Instead of walking each
moved renderer up to its repaint container, the flush now computes each
child's rectangle in its parent's coordinate space, unions the children per
parent, maps that single union up the chain once, and issues one
repaintUsingContainer() call per repaint container rather than one per
shape.
This also stops requesting outline bounds, which for SVG merely duplicated the
visual overflow rectangle, and refreshes the bounding-box and visual-overflow
caches that a layout would normally update, so getBBox() and paint or
hit-test culling never read a stale rectangle. This collapses many
backing-store invalidations into one while keeping the repainted region
minimal, closing the performance gap to the legacy SVG engine.
Non-layer SVG renderers already cache their transform in m_localTransform,
but the painting code path used to recompute it from scratch each time,
concatenating the transform list, applying transform-origin and
multiplying matrices, only because the cached value uses a different transform
origin. The paint transform is now derived directly from the cached one by
translating around the nominal origin, which removes that per-paint
recomputation and cuts the cost of painting transformed SVG content.
Fixed a repaint bug in the
Layer-Based SVG Engine (LBSE) where dynamically changing a marker's
markerUnits or orient attribute left stale pixels behind. Such a change
resizes every shape that references the marker, but a referencing shape
without a layer gets no post-layout position update, so only its new bounds
were repainted—a shrinking marker left its former area on screen.
The visual overflow rectangle, markers included, is now cached at the end of
shape layout while the geometry is still current, so a marker change can
repaint the old bounds before recomputing the new ones. The extra repaint is
limited to markers, since gradients and patterns do not affect a client's
bounds, and the resulting repaint rects are more accurate than the legacy SVG
engine's.
WPE WebKit 📟
Added a new feature flag,
BackForwardCacheWithMedia, which may be used to disable storing pages with
media content in the back-forward cache. This should solve the problem with
hardware decoders kept occupied on low-end devices in case of caching pages
with media after navigation.
Releases 📦️
WebKitGTK 2.52.5 and WPE WebKit 2.52.5 have been released, including a number of fixes for security issues, and therefore it is recommended to update. An accompanying security advisory will be published in the coming days. Additionally, these releases include small improvements and Web compatibility improvements.
In Safari Technology Preview 247, we’re introducing the Safari MCP server — a Model Context Protocol server for web developers that makes your web development and debugging workflow faster and more powerful. We know agents are increasingly integral to the coding process and the Safari MCP server gives your agent the ability to know how your code actually renders in the browser by connecting it to a Safari browser window.
Any MCP-compatible client can connect to the Safari MCP server. By connecting your agent to a Safari browser window, your agent can emulate what your users experience, giving it the information it needs to debug more autonomously, like access to the DOM, network requests, screenshots, and console output.
It speeds up your debugging process and lets you stay in the comfort of your terminal, which means fewer rounds of hopping windows and typing prompts to debug your code.
The use cases
If you build for the web, then you know about the debugging dance. It usually goes something like this:
You see something wrong with your site in the browser. You open the console to hunt it down. You click into the styles tab. You see what’s broken. You go back to your code to fix it. Or maybe you take a screenshot, detail the problem to your agent, and let it do the fixing for you. Hopefully it gets it right, the bug is fixed, and you can move on.
But when it isn’t fixed, you go through the workflow again — Browser. Prompt. Agent.
And again and again, until you finally squash the bug.
Regardless of the browser or tools you use, the debugging workflow is a lot of clicks, tools, and window hopping to make a single fix, but it doesn’t have to be that way. If you’re already using agents in your development workflow, the Safari MCP server makes your debugging faster and more efficient.
The Safari MCP server enables your agent to do more debugging and troubleshooting on its own. Here are just a few examples of what it can help with:
Web development in Safari. The next time you develop in Safari, you’ll benefit from an upgraded workflow. Your agent already helps you with your code, now it can do even more by checking out how your code actually renders in Safari.
Improve compatibility with Safari. Testing in just one browser means missing potential bugs in another, giving those users a subpar experience. With the Safari MCP server, your agent can open your site in Safari, inspect computed styles, check layout, and compare it against what you expect without switching windows.
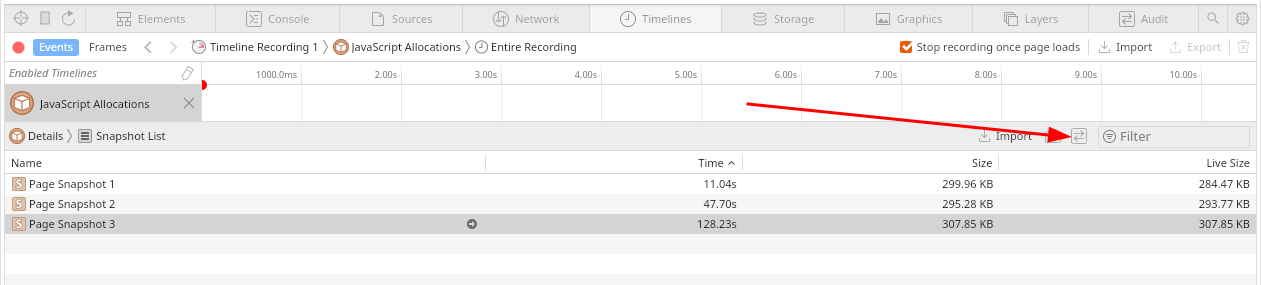
Analyze performance. See what parts of your site are slowing things down. The Safari MCP server lets your agent evaluate JavaScript on the page to surface performance metrics, like navigation timing and resource load times, so it can pinpoint what’s slowing your site down and work on the right fix.
Check for accessibility. The Safari MCP server lets your agent check for common accessibility issues like missing labels, improper ARIA attributes, and poor contrast, so you can catch problems that impact your users.
Verify any user state. Know that the page is working and looking as it should. Your agent can check the state of the form, query an element using a selector, confirm specific interactions, show different states of a checkout flow, and more. Spend less time on these manual checks and empower the agent to do it for you.
These are just a few of the use cases. However you decide to implement it, the Safari MCP server helps your agent do more for you and reduce all the back and forth that web development often requires. An easier workflow means more bugs squashed, happier users, and a better product.
The tools
Here are the available tools and what they do:
Tool
Description
browser_console_messages
Return buffered console logs for the current or specified tab
browser_dialogs
List and respond to browser dialogs (accept, dismiss, or input text for JS prompts)
close_tab
Close a browser tab by its handle
create_tab
Create a new browser tab, optionally loading a URL
evaluate_javascript
Execute JavaScript code within the page and return the result
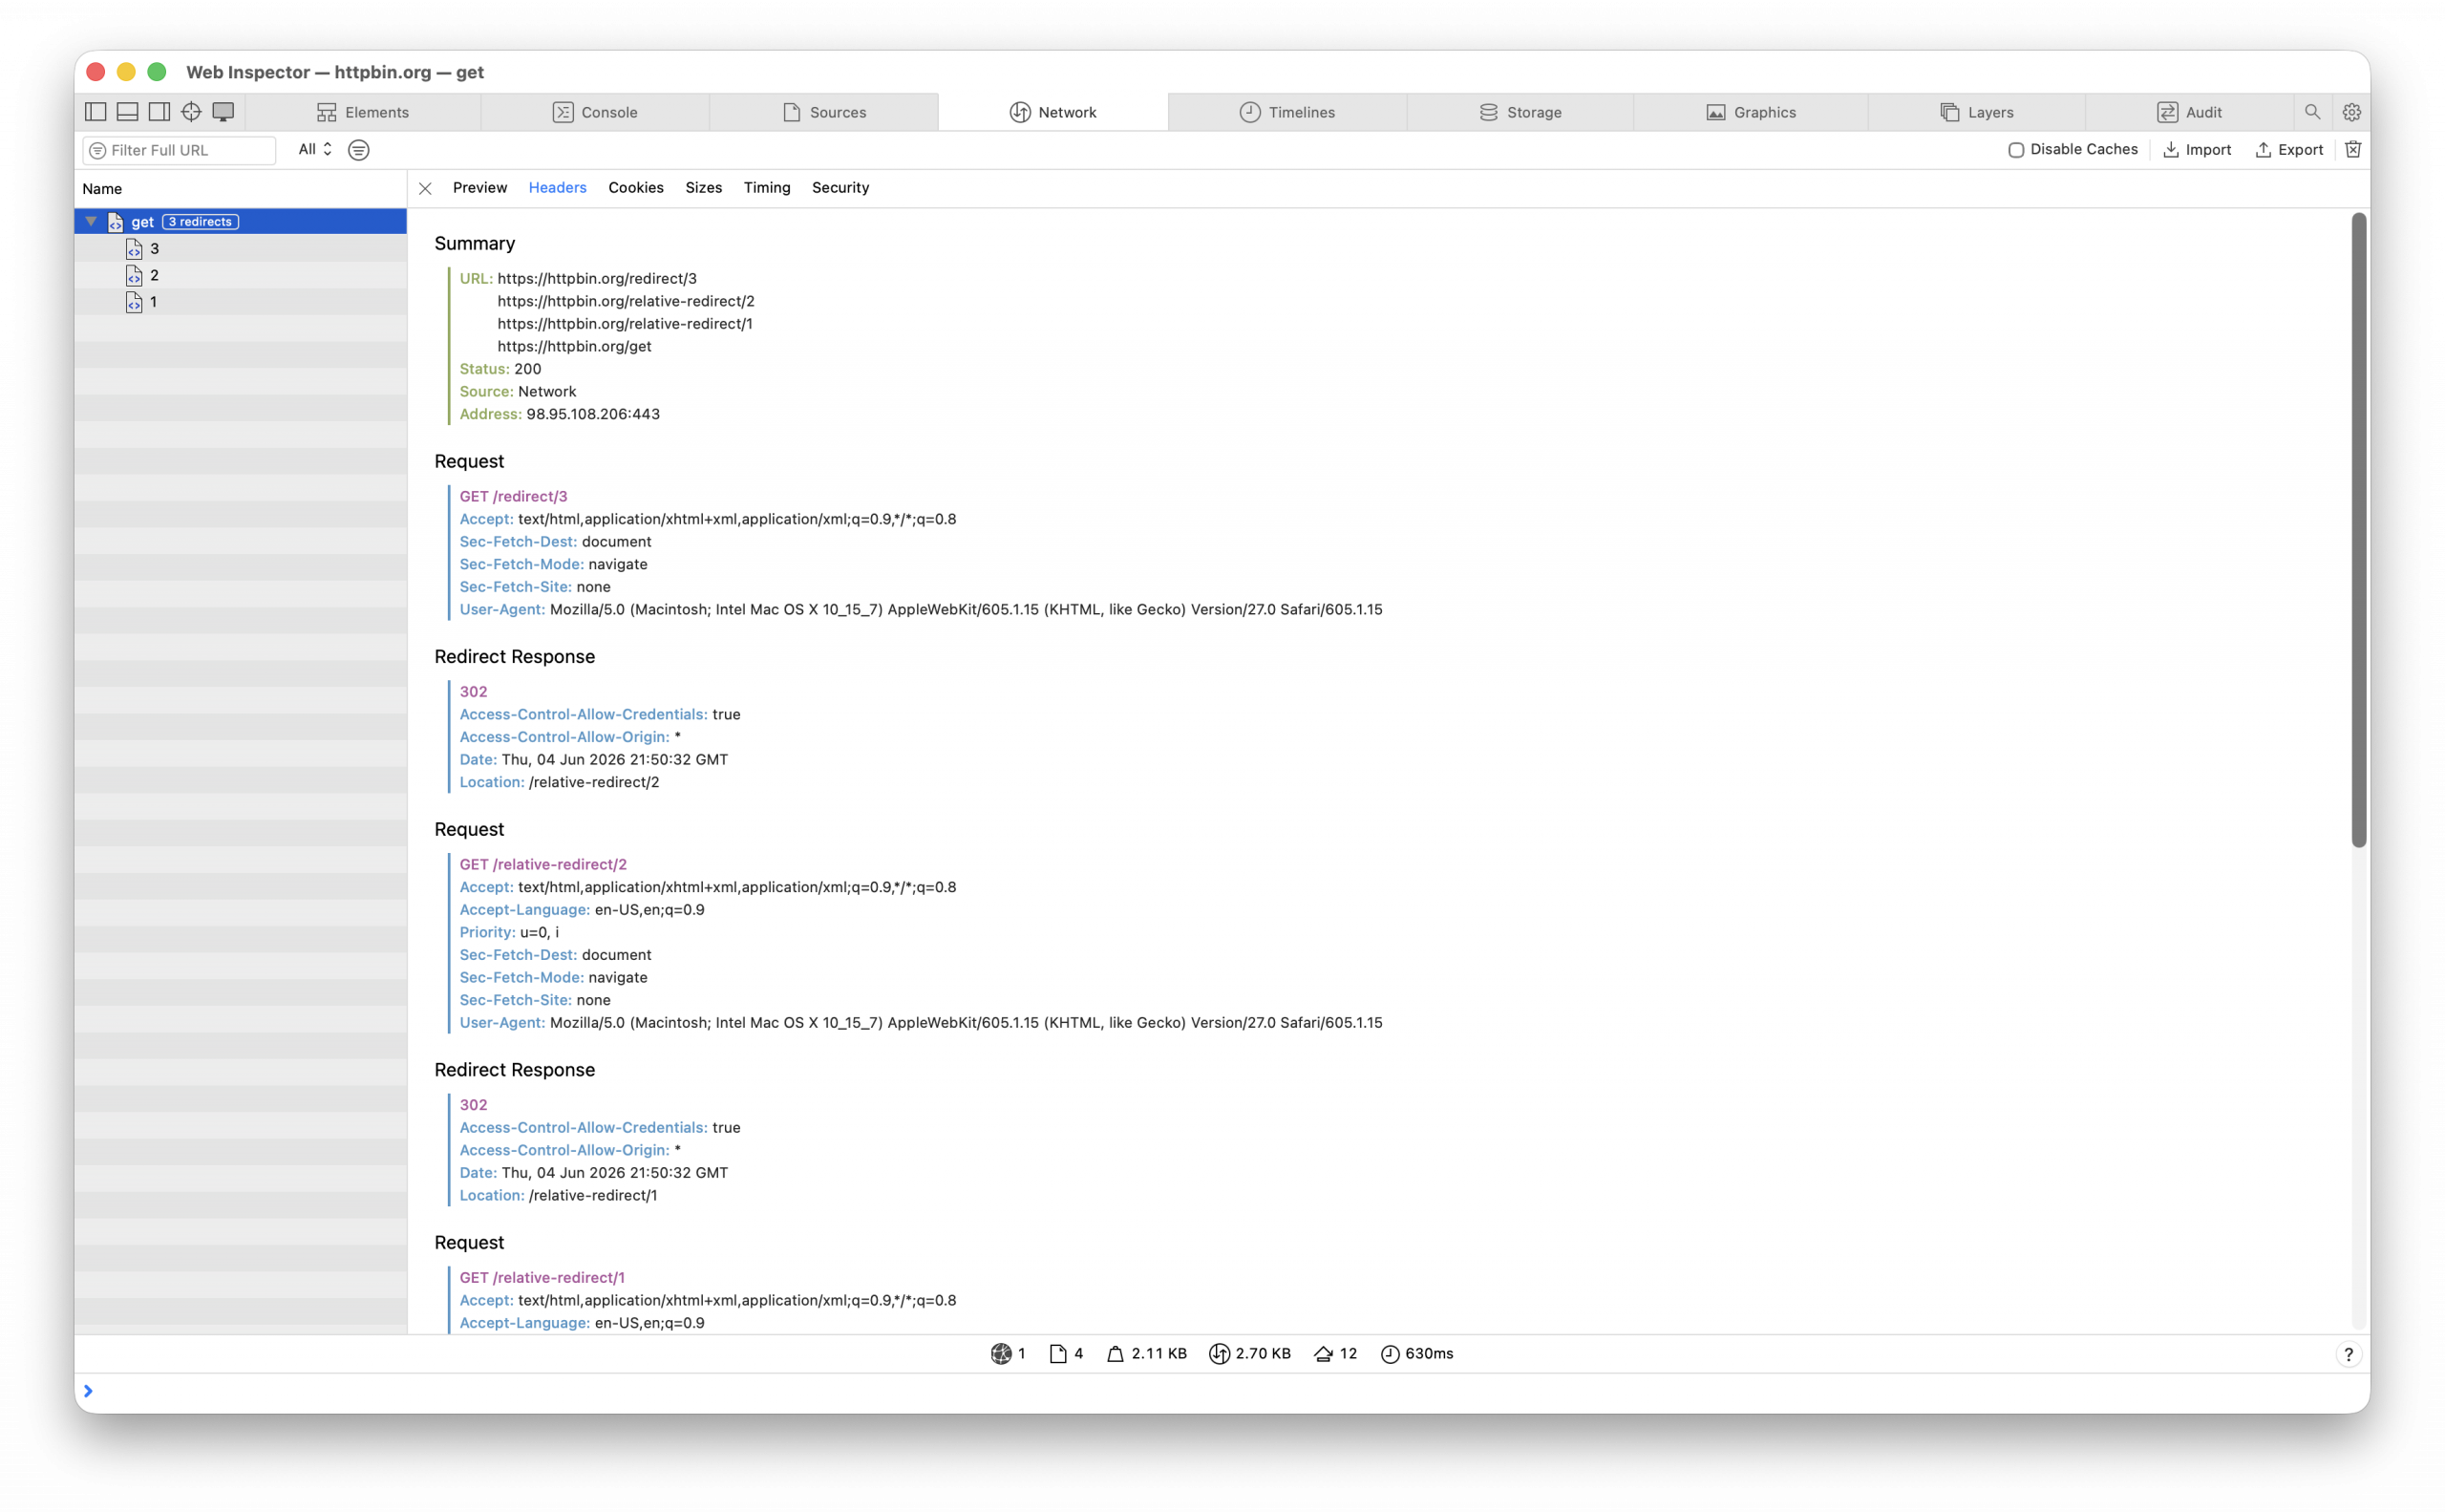
get_network_request
Get full detail for a single recorded network request (headers, body, timing)
get_page_content
Extract text content of a page in various formats (markdown, HTML, JSON, etc.)
list_network_requests
List network request summaries (URL, method, status, timing) for the current tab
list_tabs
List all open browser tabs with their handles and URLs
navigate_to_url
Navigate to a URL and return the loaded page’s content
page_info
Get info about the current page: URL, title, and loading state
page_interactions
Perform DOM interactions in sequence: click, type, scroll, hover, keyPress, etc.
screenshot
Capture a screenshot of the current page as a PNG
set_emulated_media
Emulate a CSS media type (e.g. “print”) for responsive-design testing
set_viewport_size
Set the browser viewport size in CSS pixels
switch_tab
Switch to a different browser tab by its handle
wait_for_navigation
Wait for the current page to finish loading; returns final URL and title
With the Safari MCP server, you no longer have to write the perfect prompt, carefully describing to your agent what you’re experiencing in the browser. You can give your agent the ability to find out for itself.
How to get started
First you’ll need to install Safari Technology Preview. Once installed, make sure you enable Safari Settings > Advanced > Show features for web developers. Then go to Safari Settings > Developer > Enable remote automation and external agents.
If you’re using Claude, you can use the following command in your terminal:
claude mcp add safari-mcp-stp -- "/Applications/Safari Technology Preview.app/Contents/MacOS/safaridriver" --mcp
If you’re using Codex, you can use the following command in your terminal:
Note that while the above code names the server safari-mcp-stp, you can name it whatever you like, even just safari. Once you have the Safari MCP server installed, try one of the following prompts:
Find bugs on my site in Safari
How accessible is my site in Safari?
See how my website performs in Safari
While each agent works a little differently, it shouldn’t need to be told to use the Safari MCP server explicitly — it’ll figure it out on its own. Simple prompts like the ones above are enough to kickstart the MCP.
Here’s how a conversation with an agent using the Safari MCP server might go:
You: Got a bug report — something’s broken in Safari on the flight page. Can you figure out what’s going on?
Agent: Sure, let me take a look.
Agent: I found two distinct bugs on the flight page in Safari. Want me to fix them both?
You: Yes. Anything else here that might be causing problems for Safari users?
Agent: Yes, two more things worth flagging. The results reveal animation is silently broken and the API server startup log is wrong. Should I tackle both as well?
All you need is an initial request to get started, and with the help of the Safari MCP server, your agent can take it from there.
The Safari MCP server runs entirely on your local machine and makes no network calls of its own. It also does not have access to your personal information in Safari (e.g. AutoFill or other browser activity). When it captures page content, screenshots, or console logs, that data goes directly to the agent you’re running — not to Apple. What happens to that data from there depends on the agent and model you’re using. As with any agent you give access to your browser, only use ones you trust.
Why we built this
There are many ways to build for the web, both with and without AI. If AI is a part of your workflow, we think this tool will help make it even more productive. And if it isn’t, that’s OK too.
By creating this resource, we hope to make it easier than ever to test and debug in Safari by helping your agent understand how things look and work in the browser.
If you end up giving it a try or if this is your first time using an MCP server, let us know what you think.
Safari Technology Preview Release 247 is now available for download for macOS Golden Gate and macOS Tahoe. If you already have Safari Technology Preview installed, you can update it in System Settings under General → Software Update.
Fixed VoiceOver jumping to the top of the page when navigating to an element that immediately becomes accessibility-ignored via JavaScript. (315078@main) (179065364)
Fixed VoiceOver reporting the Recent Events table on parks.wa.gov as empty. (314901@main) (179156593)
Fixed VoiceOver not exposing aria-actions custom actions when the action target is accessibility-ignored. (315097@main) (179286650)
Fixed an <a> element with a click handler but no href not being exposed as a link. (315102@main) (179398579)
CSS
New Features
Added support for calc-mix(). (314719@main) (176199063)
Resolved Issues
Fixed scroll overcompensation of fixed, nested anchor-positioned elements, so they no longer lose their position when scrolling. (314757@main) (174010503)
Fixed an issue where font-synthesis incorrectly applied synthetic oblique to variable fonts declared with @font-face. (314814@main) (178698772)
Fixed synthetic bold not being applied for a variable font whose @font-facefont-weight descriptor explicitly restricts it to normal. (314537@main) (179001275)
Fixed an issue where CSS math functions produced an incorrect signed zero for subtraction, min(), max(), clamp(), and mod(). (315188@main) (179534440)
Fixed an issue where input[type=hidden] was not set to display: none !important in the user-agent stylesheet. (315559@main) (180137214)
Fonts
Resolved Issues
Fixed an issue where synthetic bold incorrectly added advance width to zero-advance glyphs. (315157@main) (179418570)
Forms
Resolved Issues
Fixed an issue where a positive margin-top on a <legend> element inside a <fieldset> did not shift the fieldset down. (315391@main) (141267953)
HTML
Resolved Issues
Fixed an issue where <link rel=preload as=json> incorrectly triggered a preload. (315422@main) (179843455)
Fixed an issue where the deprecated align="center" attribute was not treated as identical to align="middle" per spec. (315531@main) (180128710)
JavaScript
Resolved Issues
Fixed an issue where Temporal.Instant operations were not aligned with the spec’s abstract operations. (315377@main) (179844859)
MathML
New Features
Added support for embellished operator detection through mrow for underover layout. (314924@main) (173192995)
Resolved Issues
Fixed MathML operators routed through MathOperator being invisible when their glyph only exists in a fallback font. (314928@main) (178096170)
Fixed MathML to use MathML Core fallback values for script layout constants. (315004@main) (179177178)
Media
New Features
Added support for overriding color space for hardware video decoders in WebCodecs. (314887@main) (178717498)
Added support for mapping nextslide and previousslide MediaSession actions to nexttrack and previoustrack platform commands, so pressing next/previous track invokes a registered slide handler when no direct track handler is registered. (314839@main) (178744268)
Resolved Issues
Fixed media controls not appearing when tapping videos in the LinkedIn feed on iPad. (315049@main) (171231918)
Fixed an issue where the MediaSource text-track removal loop always processed only the last track. (315310@main) (179508398)
Fixed an issue where isValidVideoFrameBufferInit() tested displayWidth and displayHeight presence against themselves instead of the correct properties. (315401@main) (179514279)
Fixed an issue where MediaMetadata artwork sizes parsing read the wrong substring for the height value. (315402@main) (179523057)
Fixed an issue where the pictureInPictureElement getter inverted the shadow-host connectivity check. (315403@main) (179675087)
Model Element
Resolved Issues
Fixed setting the entityTransform on a <model> element while the model is unloaded or hidden. (314951@main) (179114750)
Fixed <model> elements losing gesture interactivity after the model player is reloaded (for example, when the model scrolls out of and back into the viewport). (315026@main) (179249565)
Networking
Resolved Issues
Fixed an issue where WebKit refused to load valid ASCII domains starting with xn-- that did not pass strict IDNA 2008 validation, aligning behavior with the WHATWG URL Standard. xn-- is the prefix of a punycode-encoded non-ASCII domain. (314820@main) (177686282)
Fixed an issue where arbitrary Content-* headers from 304 responses were not used to update cached entries. (315449@main) (179864251)
Fixed an issue where the Cache-Control request directives max-age, min-fresh, and no-store were not honored. (315447@main) (179865576)
Fixed an issue where Cache-Control: public was not honored on responses with unknown status codes. (315445@main) (179870099)
Fixed an issue where the HTTP cache did not store responses with explicit freshness for all status codes. (315450@main) (179871690)
Rendering
Resolved Issues
Fixed text-wrap: balance not being applied to content with -webkit-line-clamp. (314783@main) (172715503)
Fixed an issue where text changes that did not modify the text element’s size in a flex layout on a new compositing layer did not trigger re-rendering. (315173@main) (179292409)
Fixed an issue where an underline was drawn twice on <sup> elements. (315220@main) (179537119)
Fixed an issue where an underline under a <sup> element was offset by one device pixel from the rest of the line on subpixel displays. (315316@main) (179586525)
Fixed an issue where the ex unit in text-box-edge misplaced the propagated underline, causing it to be painted twice. (315331@main) (179769451)
Fixed an issue where min-width was not honored over max-width when sizing a shrink-to-fit container around a replaced element. (315396@main) (179935558)
SVG
Resolved Issues
Fixed SVG applying text-decoration to elements with display: contents. (314830@main) (85691104)
Fixed SVG <text> with textLength scaling each glyph separately when x or y is a list. (315146@main) (94161279)
Fixed an issue where box-shadow was not drawn on fixed-positioned SVG elements. (315468@main) (97098951)
Fixed an issue where an SVG filter applied via CSS to an element positioned below the viewport rendered a spurious black square at the viewport origin. (315329@main) (177482001)
Fixed IntersectionObserver not computing intersections for SVG element roots. (314837@main) (177807041)
Fixed SVG vertical <text> to honor the CSS text-orientation property instead of only the deprecated glyph-orientation-vertical presentation attribute. (315080@main) (178044217)
Fixed an issue where getRotationOfChar() returned approximately 360° instead of 0° for full-turn rotations after normalisation into the [0°, 360°) range. (315293@main) (178044934)
Fixed an issue where a non-BMP character before a <tspan> boundary shifted the x and y value lists by one position. (315418@main) (178360036)
Fixed interpolation of arc flags in the d property to treat them as non-zero booleans. (314745@main) (178950624)
Fixed pathFromEllipseElement to honor auto values for rx and ry, so APIs such as getTotalLength() return the correct length for ellipses. (314846@main) (178959205)
Fixed animated GIFs freezing when presentation attributes are changed on an SVG image referenced by a <use> element. (315094@main) (179414226)
Fixed an issue where getBoundingClientRect() on an SVG <tspan> element returned the bounds of the entire <text> element instead of the <tspan>‘s own area. (315234@main) (179626476)
Fixed an issue where a nested clip-path on a <clipPath> element ignored css zoom. (315562@main) (180162723)
Scrolling
Resolved Issues
Fixed an issue where scrollIntoView with nearest alignment incorrectly aligned to the far edge for an oversized target positioned before the scrollport. (315225@main) (106356373)
Fixed a regression on macOS 26 where horizontal rubber-banding interfered with vertical scrolling. (315424@main) (165449829)
Fixed an issue where scroll snapping selected a snap point that overshot the destination instead of the closest one in the scroll direction. (315522@main) (179549119)
Fixed an issue where interrupting a smooth scroll with a new scrollTo() call to a different target fired the scrollend event at the wrong position. (315471@main) (179551854)
Fixed an issue where re-snapping after a layout change moved away from a valid scroll position when the snap area was larger than the snapport. (315291@main) (179553122)
Security
Resolved Issues
Fixed an issue where Content Security Policy 'self' did not match script sources in opaque-origin HTTP(S) documents. (314912@main) (178638597)
Fixed an issue where Content Security Policy incorrectly applied script-src to JSON module imports instead of connect-src. (315497@main) (180006320)
Spatial Web
Known Issues
WebXR might not render when you use Simulator. (178666073)
Workaround: Use an Apple Vision Pro device instead of Simulator.
Resolved Issues
Fixed an issue where transforming the camera instead of the model in a <model> element led to undesirable lighting effects. (312407@main) (179522538)
Deprecations
Removed the Spatial Backdrop developer preview in favor of the Immersive API. (315100@main) (160271766)
Text
Resolved Issues
Fixed a line break appearing after a U+201D Right Double Quotation Mark. (314829@main) (177952069)
Web API
Resolved Issues
Fixed an issue where the URL Pattern tokenizer emitted a spurious zero-length Regexp token for empty regexp groups. (315289@main) (179452346)
WebDriver
New Features
Allow your agent to connect to a Safari browser for development and debugging via the Safari MCP server. (176038457)
Resolved Issues
Fixed an issue where the WebDriver full page screenshot was clipped to the viewport dimensions instead of the full page. (315337@main) (179840186)
WebGL
Resolved Issues
Fixed a regression where a WebGL canvas was filled with opaque content that hid stacked canvases beneath it. (315018@main) (175352260)
Update on what happened in WebKit in the week from June 22 to June 29.
After a small break after the Web Engines Hackgest, we're back with another
round of updates, this time with a couple of exciting improvements to the
SVG engine, a WebRTC fix, and support for WebP images with the toDataURL()
API.
Cross-Port 🐱
Made RenderLayer creation conditional for SVG renderers in the new Layer-Based SVG Engine (LBSE), so a layer is now only created when one is actually needed for intrinsic reasons (3D transforms, opacity, etc.) instead of unconditionally for every renderer. Plain 2D transforms no longer force a layer and are applied directly during painting. This is the groundwork for follow-up patches that remove the intrinsic need for layers when applying clipping, masking and filters to SVG subtrees. It is an important milestone towards reducing the overhead that has been holding back LBSE performance compared to the legacy SVG engine.
Fixed the paint order of non-composited children around composited SVG siblings in the Layer-Based SVG Engine (LBSE). A layered container paints its children from a single flat list in DOM (and SVG paint) order, but some children are composited into their own GraphicsLayer for reasons like will-change, a 3D transform or certain opacity cases. The flat child list is now split into contiguous paint-order segments at those boundaries, with each run of plain children painted by its own overlay layer placed at the correct depth in the compositor's child list. This keeps every child in its DOM order without giving trailing siblings a RenderLayer or backing store of their own, and a container with no composited children produces no segments at all, so the common case costs nothing. This allows us to support composition within LBSE subtrees in a performant way, after dropping the requirement that every renderer creates a layer.
Multimedia 🎥
GStreamer-based multimedia support for WebKit, including (but not limited to) playback, capture, WebAudio, WebCodecs, and WebRTC.
Fixed initial decoding issues on LibWebRTC on platforms that do video decoding on the final playback stage (for efficiency and performance), instead of on the LibWebRTC decoder component.
Safari Technology Preview Release 246 is now available for download for macOS Golden Gate and macOS Tahoe. If you already have Safari Technology Preview installed, you can update it in System Settings under General → Software Update.
Fixed an issue preventing VoiceOver from following focus() calls for newly added elements. (313425@main) (177167634)
Fixed role computation for elements with prefixes. (314273@main) (178399441)
CSS
New Features
Added support for <image> values in light-dark(<image>, <image>). (314244@main) (172290840)
Added support for using the CSS attr() substitution function on pseudo-elements with non-trivial originating elements. (313684@main) (177595332)
Added support for image(<color>) in the <image> value type. (314204@main) (178189616)
Enabled the font-variant-emoji property in preview. (314117@main) (178193814)
Enabled word-break: auto-phrase in preview. (314118@main) (178193962)
Added support for color-mix() with more than two colors. (314272@main) (178349405)
Added support for the alpha() relative color function. (314397@main) (178551773)
Resolved Issues
Fixed aspect-ratio intrinsic-size handling in flex layout to align with the specification. (313536@main) (83240099)
Fixed text-decoration-thickness propagation to inner spans with non-inline style. (314502@main) (111015539)
Fixed unnecessary text truncation that could occur with always-on scrollbars. (313584@main) (148428628)
Fixed CSS Container Style Queries to work when the container has display: contents. (313677@main) (164414720)
Fixed CSS Style Container Query to recognize the default value of a custom property in multiline cases. (313957@main) (165627262)
Fixed CSS Anchor Positioning so that absolutely positioned elements no longer anchor to viewport-fixed-position elements unexpectedly. (314706@main) (170323196)
Fixed -webkit-box-pack to account for box-direction and to handle overflow repositioning correctly. (313862@main) (174588996)
Fixed an emoji reaction overlapping the comment code box on GitHub. (311084@main) (174652842)
Fixed :hover state to repaint correctly on the customizable <select> element. (310623@main) (175273152)
Fixed text in nested CSS Subgrid with overflow: hidden clipping content on subsequent items. (313503@main) (175877530)
Fixed an interaction between an img with max-width and surrounding elements that caused the parent’s layout to compute incorrectly. (313105@main) (176889859)
Fixed incorrect margin offsets for inline <div> positioning to fix the broken layout of paragraph spacing on some sites. (313502@main) (177139092)
Fixed shrink-to-fit boxes to update their width when they gain or lose a scrollbar. (313390@main) (177172896)
Fixed CSS zoom to be animatable by the computed value. (313735@main) (177411607)
Fixed preferred width to trim trailing whitespace before a preserved newline. (313480@main) (177426037)
Fixed inline layout to apply margins of preceding block content at the line start eagerly when block-in-inline content is involved. (313489@main) (177438841)
Fixed CSS attr() to align with disallowing the <url> type. (313593@main) (177540489)
Fixed CSS attribute selector case-insensitivity handling for HTML attributes. (313654@main) (177547701)
Fixed ::first-letter to use the correct definition of punctuation. (313652@main) (177599506)
Fixed offset-path to respect <coord-box> when blending shape() and basic-shape paths. (313737@main) (177685457)
Fixed stretch-fit width with aspect-ratio providing a definite cross size to flex items when it should not. (313723@main) (177705930)
Fixed an aspect-ratio flex container resolving descendant percentage heights against a stale logical height. (313727@main) (177711905)
Fixed inline-block baseline to fall back to the bottom margin edge when the content has no in-flow line boxes. (313769@main) (177753094)
Fixed programmatic focus after keyboard interaction to match :focus-visible. (314012@main) (177850766)
Fixed @font-facefont-style to serialize ‘oblique 0deg’ as ‘normal’. (314128@main) (178185291)
Fixed serialization of explicit font-variant longhands set after a system font. (314292@main) (178251443)
Fixed CSSFontFeatureValuesRule.fontFamily to be settable rather than readonly. (314602@main) (178323504)
Fixed font-style: oblique to be clamped against the font’s slant range rather than the @font-face weight range. (314280@main) (178324521)
Fixed font-style: oblique angle being applied to the variable font ‘slnt’ axis with the wrong sign. (314399@main) (178326843)
Fixed background and mask coordinated property list resolved values to match the specification. (314242@main) (178378309)
Fixed longer hue interpolation when one input is none. (314327@main) (178476769)
Fixed line-through to render with the correct thickness over a descendant inline box. (314391@main) (178547557)
Fixed font-synthesis to avoid synthesizing styles outside of a font’s variable axis range. (314537@main) (178550149)
Fixed font-style: italic to slant a variable font whose @font-face uses an oblique angle. (314681@main) (178566326)
Fixed SVG intrinsic sizing so that height: max-content uses the used width rather than the default width. (314556@main) (178712792)
Fixed color-mix() to allow percentages that sum to zero. (314577@main) (178758710)
Fixed color-mix() resolution for the new 0% rules. (314714@main) (178921722)
Fixed a flex item with min-width: min-content being clamped to a smaller max-width. (314599@main) (178777567)
Canvas
New Features
Made the radii argument of CanvasPath.roundRect() optional. (313882@main) (177944903)
Resolved Issues
Fixed canvas 2D context to set the origin-clean flag when reset. (313824@main) (177858398)
Fixed canvas fillText with textAlign=center misplacing complex-shaped text. (314522@main) (178682402)
Editing
Resolved Issues
Fixed typing Hindi (InScript) input on Google Docs. (297270@main) (177643899)
Forms
Resolved Issues
Fixed identically sized buttons to render with consistent corner radius. (313535@main) (173786057)
Fixed a box with percentage offset (e.g. top: 100%) being mispositioned when its containing block is out-of-flow with percentage height. (313364@main) (177181803)
HTML
New Features
Added support for popover close watcher integration. (313838@main) (129116634)
Added support for SVG <a> as an argument to Origin.from(). (314287@main) (178426374)
Resolved Issues
Fixed popover light dismiss to account for input buttons. (313840@main) (171352032)
Fixed popover light dismiss to account for disabled command buttons. (314400@main) (171358576)
Fixed a regression that broke pushState with custom application URL schemes. (312738@main) (177547157)
Fixed outerHTML setter to align with the HTML standard. (313795@main) (177788638)
Fixed fragment parsing of xmlns="" inheritance and annotation-xml encoding. (313803@main) (177808494)
Fixed createHTMLDocument() to no longer leave the body in a parsing state. (314295@main) (178440940)
Fixed text fragment matching so that a prefix is no longer matched outside of a word boundary near the start of the document. (314323@main) (178467104)
Images
Resolved Issues
Fixed images appearing then quickly disappearing on OpenTable search results. (313572@main) (176275269)
Fixed <picture><source> candidates being speculatively preloaded even when the inner <img> has loading=lazy. (313833@main) (177833110)
Fixed HTMLImageElement.decode() to no longer resolve spuriously after adoption, src change, or cached-image reuse. (314536@main) (178118012)
JavaScript
Resolved Issues
Fixed multiple TypedArray constructor edge cases involving buffer sequences to align with the specification. (313401@main) (176724918)
Fixed WebAssembly.Memory and WebAssembly.Module to align their cloning and transferring behavior with SharedArrayBuffer. (313482@main) (176792374)
Fixed Array.prototype.join to include prototype elements added during element toString invocation. (314210@main) (178055452)
Media
Resolved Issues
Fixed WebVTT to not display cues that are larger than the viewport. (314333@main) (136809012)
Fixed <audio controls> to not show the “Subtitles” option when no subtitle track is present. (311465@main) (175357130)
Fixed MSE SourceBuffer.remove() to no longer remove an extra sample, and fixed buffered ranges to cover the correct ranges. (313383@main) (177065364)
Fixed an HTMLMediaElement that doesn’t display in an infinite scrolling webpage to use a viewport listener that notifies the media player about the visibility of the element. (311380@main) (177081214)
Fixed EME to use a 10 second key wait timeout. (313873@main) (177936893)
Fixed EME OCDM to prevent a spurious keystatuses event when all keys have expired. (313876@main) (177939767)
Fixed getSupportedCapabilitiesForAudioVideoType (EME) to no longer include unsupported capabilities. (314032@main) (178142768)
Fixed MediaSession.setActionHandler to not throw an exception when called. (314546@main) (178167294)
Fixed AudioData.copyTo to throw RangeError when frameOffset equals numberOfFrames. (314451@main) (178609688)
Fixed MIDI and AVI MIME signature matching due to a typo in MIME sniffing. (314499@main) (178661530)
Fixed PannerNode to no longer produce non-finite samples for edge-case distance parameters. (314608@main) (178784571)
Networking
Resolved Issues
Fixed URL parsing for sendBeacon() and the Media Session API. (313403@main) (177330315)
Rendering
Resolved Issues
Fixed Google search-suggestion font sizes increasing on rotation from portrait to landscape. (313547@main) (113801810)
Fixed misrendering of Pahawh Hmong text on Wikipedia. (313458@main) (167446860)
Fixed a black region appearing on the right side of swift.org when the sidebar is open. (313513@main) (173191807)
Fixed <legend> to mask the <fieldset>‘s border correctly when it has a negative left margin. (313863@main) (174185071)
Fixed a regression that caused incorrect layout in some content using stretch. (309433@main) (176398251)
Fixed justification expansion to apply around CJK Unified Ideographs Extensions E, F, G, and H. (313586@main) (176759766)
Fixed RTL position-fixed elements losing their contents when the document is scrolled on iOS. (313573@main) (177454608)
SVG
New Features
Made SVG <use> work without specifying a fragment identifier. (313550@main) (148973201)
Resolved Issues
Fixed the resolved value for the width and height properties on SVG <rect>, <image>, <svg>, and other elements. (313859@main) (96320059)
Fixed an animated GIF freezing when referenced by SVG <use> and the opacity was adjusted. (313531@main) (96837306)
Fixed vector-effect to apply a transform to path geometry rather than to stroke geometry. (314302@main) (103573160)
Fixed <animateMotion> non-path animations to apply the rotate attribute. (314508@main) (110915794)
Fixed SVG elements with display: contents being visually hidden. (314079@main) (141825746)
Fixed SVGPathElement.getTotalLength() and . SVGPathElement.getTotalLength.getPointAtLength() to respect the CSS d property. (314654@main) (167195297)
Fixed a rounding issue for SVG rect height with em and percentage values. (313935@main) (171587382)
Fixed SVG intrinsic sizing so that max-content and min-content use the viewBox aspect ratio when intrinsic sizes are missing. (313864@main) (174568894)
Fixed glyph-orientation-vertical: auto to decode surrogate pairs for UTR#50 lookup. (314070@main) (175570881)
Fixed handling of pathLength="0" and negative pathLength for stroke dashing. (314001@main) (175928827)
Fixed hit-testing of clip-path with nested objectBoundingBox<clipPath> to use the correct reference box. (313855@main) (177605894)
Fixed SVG overflowing edges when offset by a fractional value. (313886@main) (177630386)
Fixed feGaussianBlur not applying when stdDeviation contains a 0 in the second component. (313874@main) (177906905)
Deprecations
Removed support for the non-standard glyph-orientation-horizontal property. (314069@main) (176134352)
Scrolling
Resolved Issues
Fixed scrolling of the “Add Contacts” drop-down on outlook.live.com by narrowing the scope of a quirk. (314111@main) (48008837)
Fixed a passive: false wheel event listener combined with overscroll-behavior: contain preventing scrolling. (314170@main) (137757208)
Fixed the scroll anchoring behavior so that the comments panel on Quip is no longer blank when expanded. (314371@main) (178255628)
Storage
New Features
Added support for storing FileSystemHandle objects in IndexedDB. (314229@main) (176102643)
Resolved Issues
Fixed IndexedDB connections in workers to recover after a network process crash. (313509@main) (177219395)
Web API
New Features
Added support for the Origin-Agent-Cluster HTTP response header. (314346@main) (69452369)
Resolved Issues
Fixed IntersectionObserver to no longer notify targets in detached documents. (313834@main) (162699098)
Fixed IntersectionObserverEntry.boundingClientRect to honor CSS zoom aware getBoundingClientRect. (313512@main) (177250323)
Fixed IntersectionObserver to report correct bounds for SVG element targets. (313596@main) (177260411)
Fixed Web Locks API to remove the AbortSignal abort algorithm after a lock request settles. (314433@main) (178589067)
Web Extensions
Resolved Issues
Fixed cross-origin XMLHttpRequest from a Safari Web Extension to no longer trigger an additional permissions request. (313506@main) (154866064)
Web Inspector
New Features
Added a separate column to show the node associated with layout and rendering events. (314460@main) (177618501)
Resolved Issues
Fixed hovering over a node in a preview for a collection to highlight the node in the inspected page. (314589@main) (20341722)
Fixed style sheets created via CSSOM (such as adoptedStyleSheets) being incorrectly marked as User Agent Style Sheets. (313738@main) (134101594)
Fixed clearing the Console tab search field to dismiss the Clear Filters button. (313599@main) (176388155)
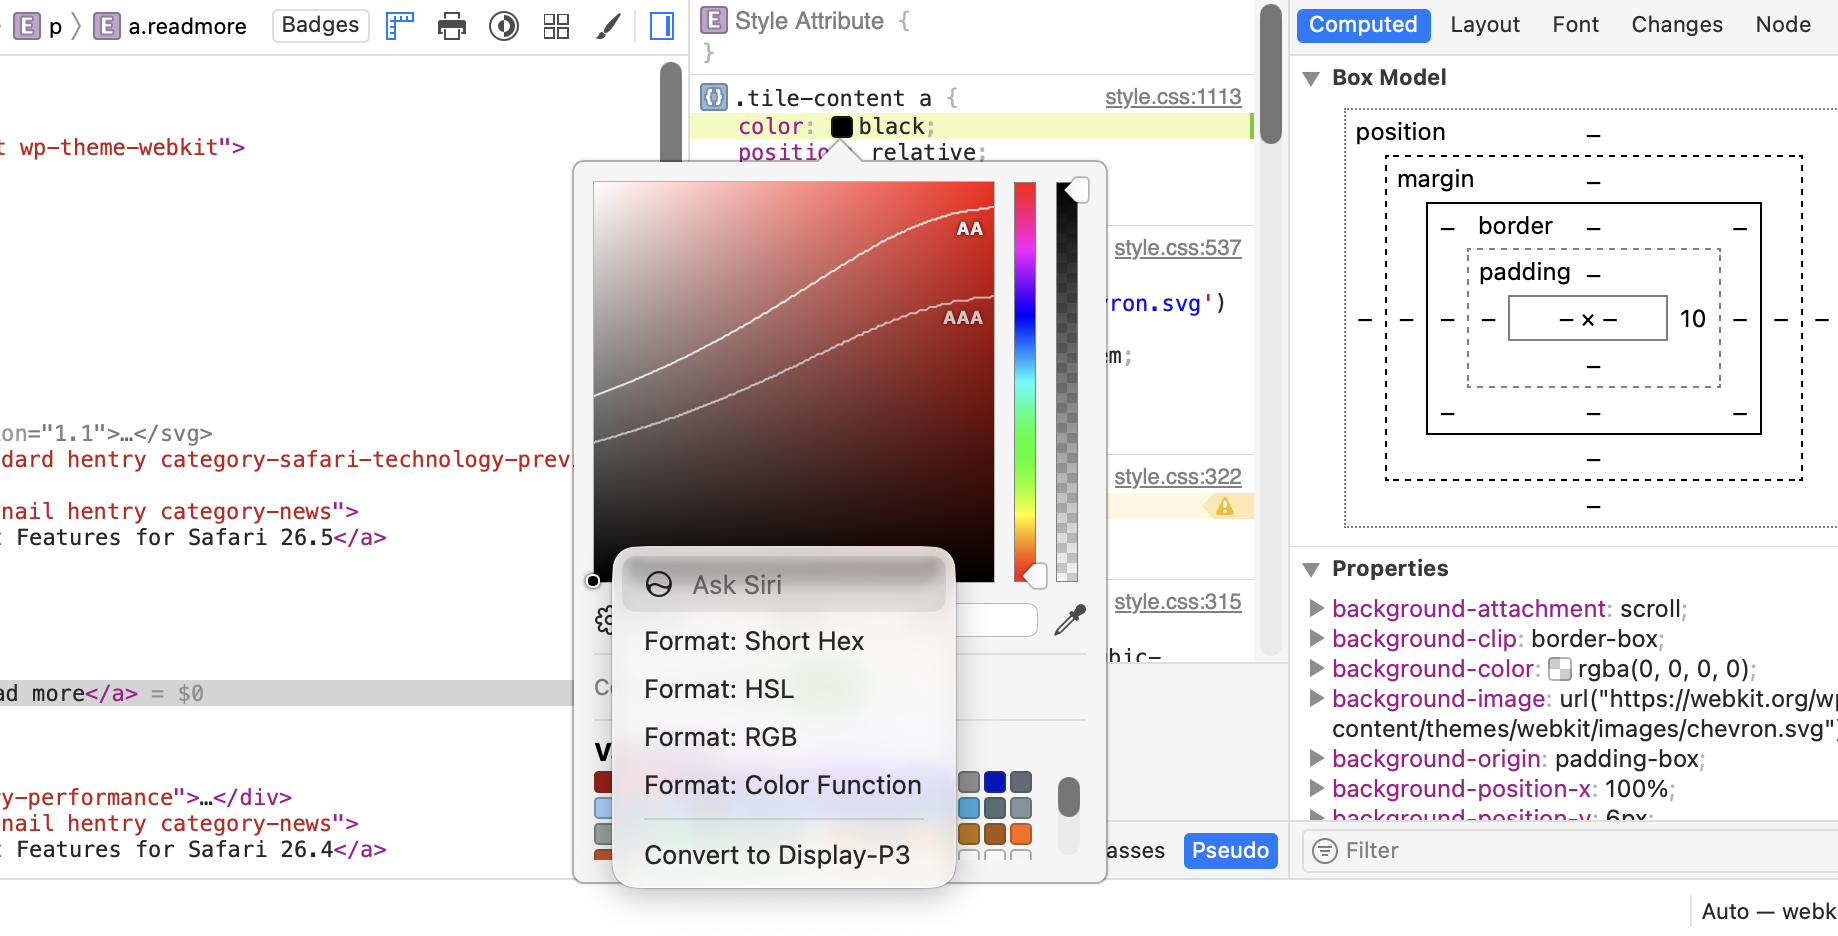
Fixed properties added to an element’s Style Attribute sometimes disappearing momentarily. (314467@main) (178053421)
WebGPU
Resolved Issues
Fixed WGSL parser handling of identifiers per the latest specification. (313405@main) (177008615)
Update on what happened in WebKit in the week from June 9 to June 16.
The major highlight this week is the Web Engines Hackfest! Despite it, there
are a variety of updates as well, such as various improvements to input
handling in WPE WebKit and WebKitGTK, WPE menu rendering changes, and a
plethora of other smaller improvements.
Due to GTK not providing an equivalent value for GtkInputPurpose, the default behaviour is to continue mapping search fields to GTK_INPUT_PURPOSE_FREE_FORM as before; but custom input methods may use the new value to detect search inputs. When using WPEPlatform, the value is mapped to WPE_INPUT_PURPOSE_SEARCH, which has been added as well.
WPE now renders its own popup menus for elements such as select. It supports all styling options the web provides such as colors and fonts. The internal menu can be overriden with the existing WebView::show-option-menu signal. Cog for example still renders its own (with a recent commit).
Community & Events 🤝
The Web Engines Hackfest started! We had a fantastic first day of talks, and now are heading to breakout sessions. Make sure to check the schedule for sessions that may interest you!
Customizable select is coming to Safari 27. With this technology, developers can fully control the appearance of <select> elements — custom arrows, option layouts, color swatches, icons, full visual styling — without the need for JavaScript libraries or an endless parade of <div> elements. And because it’s a built-in control, you don’t have to compromise on keyboard navigation or accessibility semantics.
But, to ensure this built-in control works well for everyone, it’s important to follow this single but essential rule: always provide text content or accessible text attributes for your option elements.
Every time that rule is broken, every time an option is styled to show a visual without any text and without any accessible fallbacks, three different problems get introduced all at once. The menu is harder to use for everyone, impossible to use with accessibility tools, and it becomes a completely broken experience in browsers that don’t support it yet.
When you remember to follow the rule, you’ll improve the user experience, support accessibility, and provide progressive enhancement so it works for people regardless of what browser they choose.
We’ll show you why following this mission critical rule gets you:
Better UX
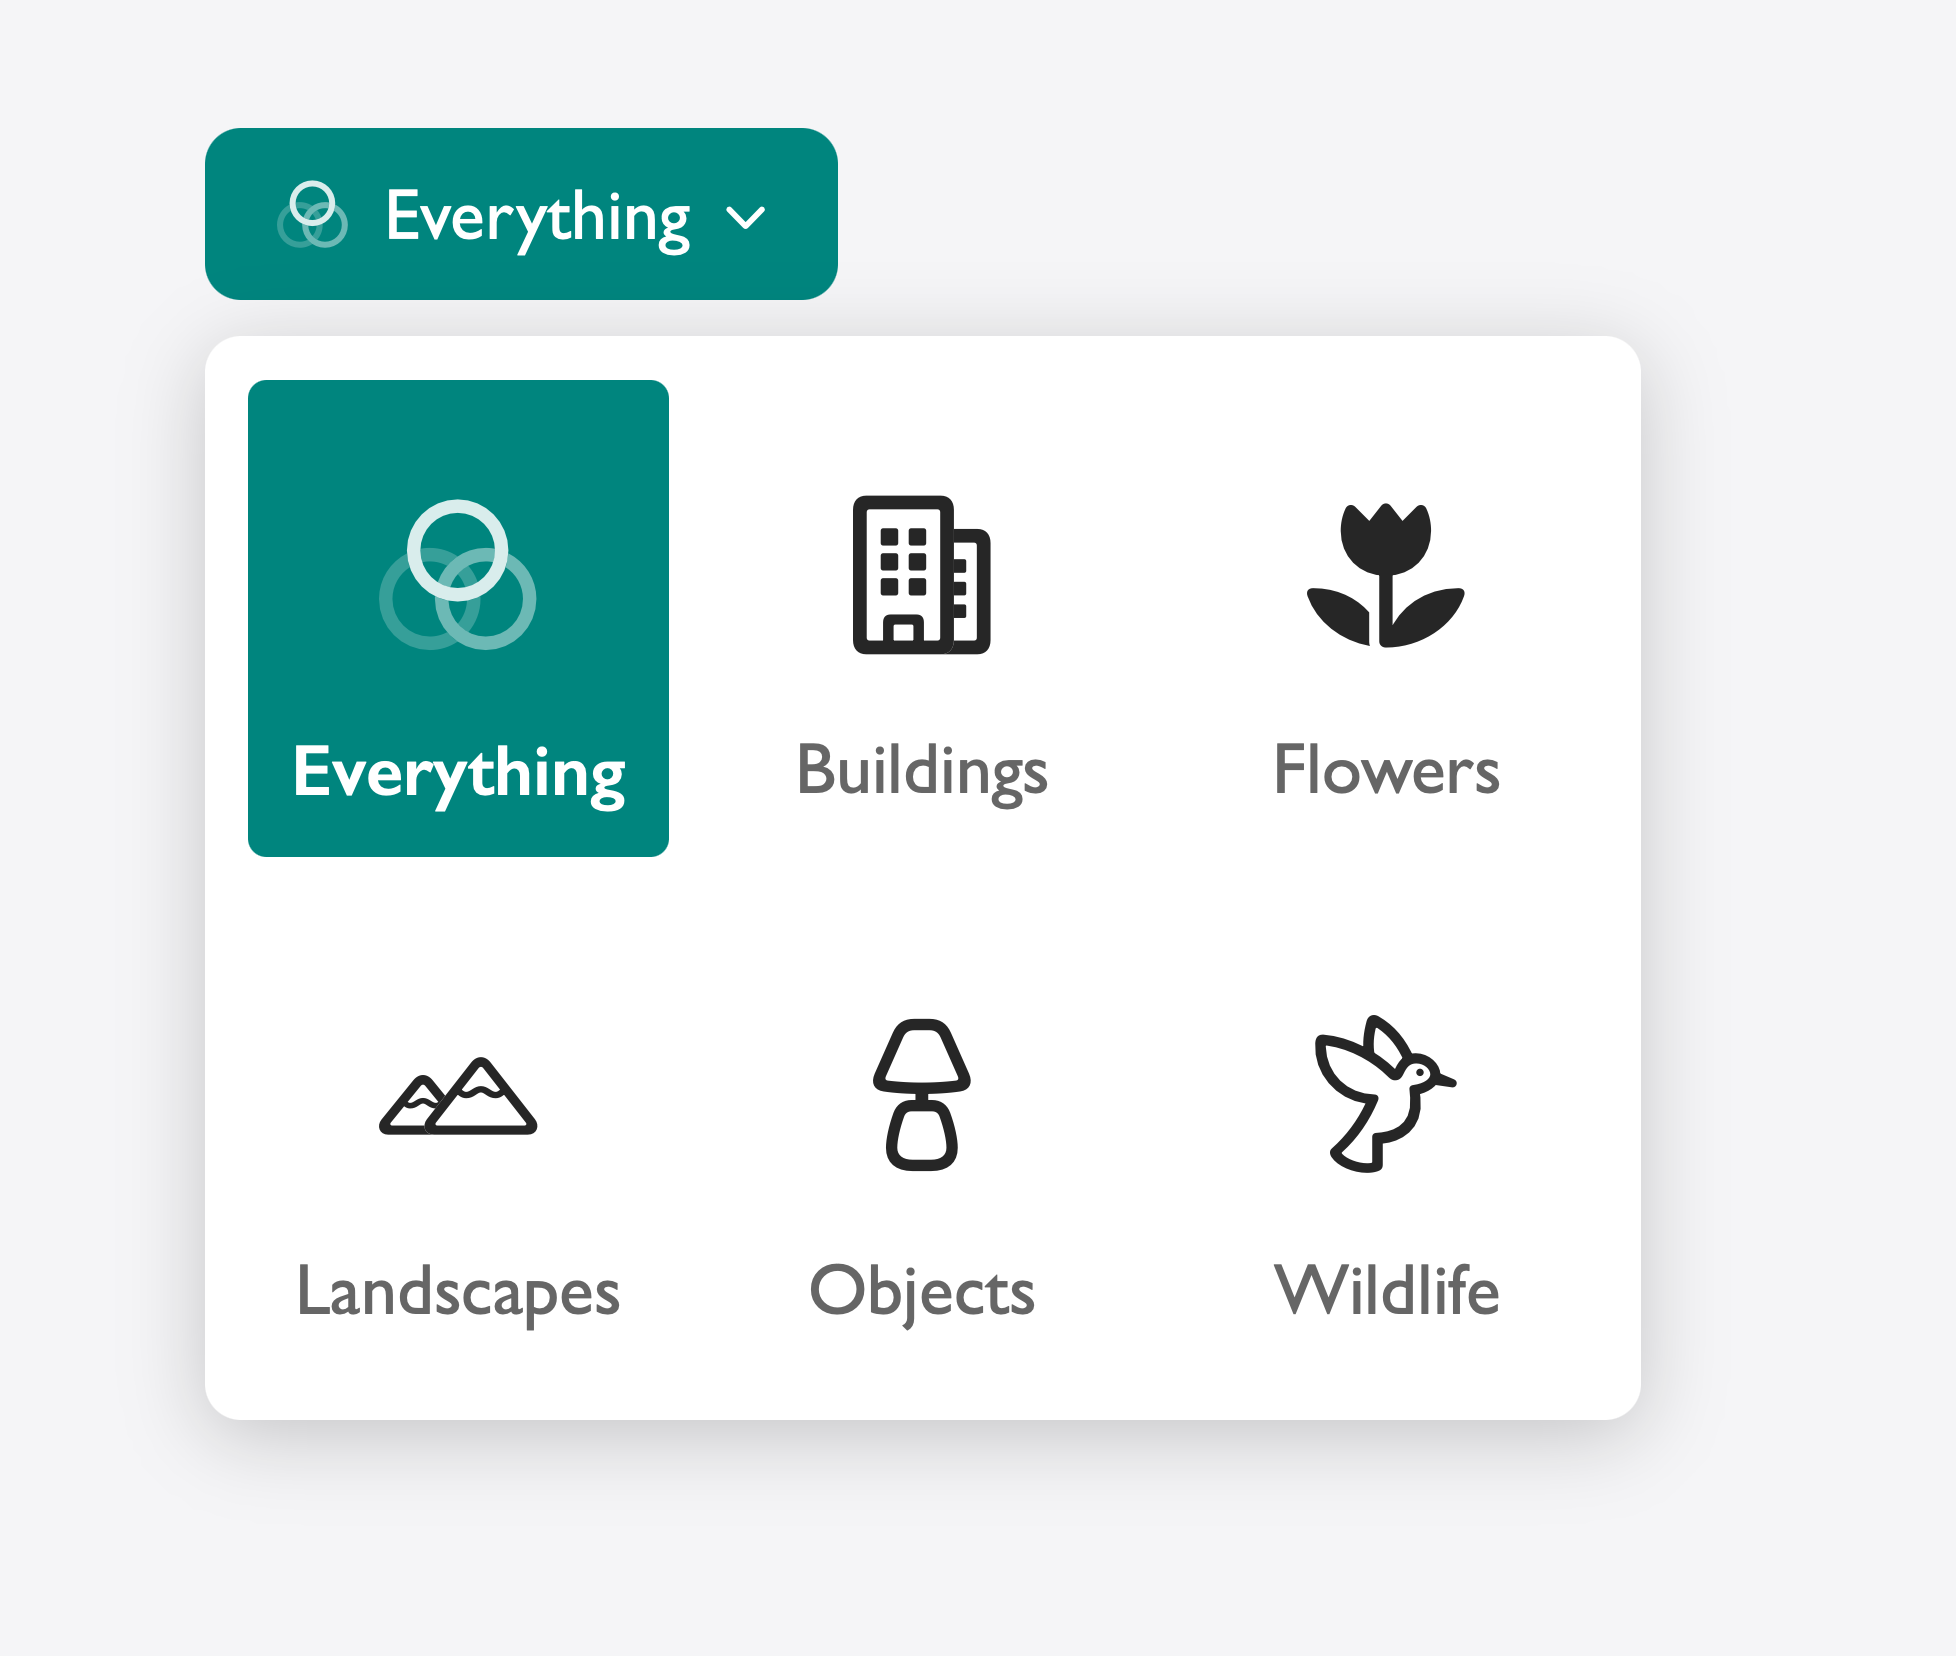
Take this category filter from a photographer’s gallery site. The version below uses icons alone — a building, a flower, a hummingbird — to represent each category:
It looks clean. But a user who doesn’t immediately recognize what the hummingbird icon represents has no fallback. The closed select shows only an icon in the button, with no other hint of what’s currently selected. Add a text label to each option and the experience becomes immediately scannable. The selected state is readable at a glance, and every option is unambiguous:
The icons are still there. The labels make it readily decipherable for everyone.
Better accessibility
When a screen reader encounters an option with no text, the user may not hear a descriptive label for each option. Braille rendering and other assistive technology output may also be confusing. Text, even when hidden visually with a .visually-hidden class, stays in the accessibility tree and gives screen readers, braille displays, and speech recognition software something real to work with. If you use an icon as an <img>, add an alt or aria-label — or mark it decorative using alt="" and let the visible or visually-hidden label carry the meaning.
The problem you solve isn’t just a compliance checkbox: it’s the difference between a visitor completing your form and someone abandoning it.
Better progressive enhancement
Customizable select is a new feature. Browsers that don’t yet support it fall back to the platform-native <select> — which is exactly the right behavior, as long as your options still make sense in that fallback state.
If you’ve removed text in favor of icons or swatches, a user on an older browser sees a dropdown full of empty options. The same is true when CSS fails to load at all: a slow connection, a corporate proxy stripping stylesheets, a user with custom styles enabled. Wrap your enhancements in @supports (appearance: base-select) and keep plain text as your baseline. Adding a swatch is an enhancement. Removing the color name to make room for it is a regression.
The rule for maximizing the power and utility of customizable select is simple: keep the text. You can hide it visually. You can make it tiny. You can position it off-screen. But it needs to be there. Icons, swatches, and illustrations are additions to an option — never substitutes for it. Follow that rule and the rest of customizable select is yours to play with.
Feedback
We love hearing from you. To share your thoughts, find our web evangelists online: Saron Yitbarek on BlueSky, Jen Simmons on Bluesky / Mastodon, and Jon Davis on Bluesky / Mastodon. You can follow WebKit on LinkedIn. If you run into any issues, we welcome your feedback on Safari UI (learn more about filing Feedback), or your WebKit bug report about web technologies or Web Inspector. If you run into a website that isn’t working as expected, please file a report at webcompat.com. Filing issues really does make a difference.
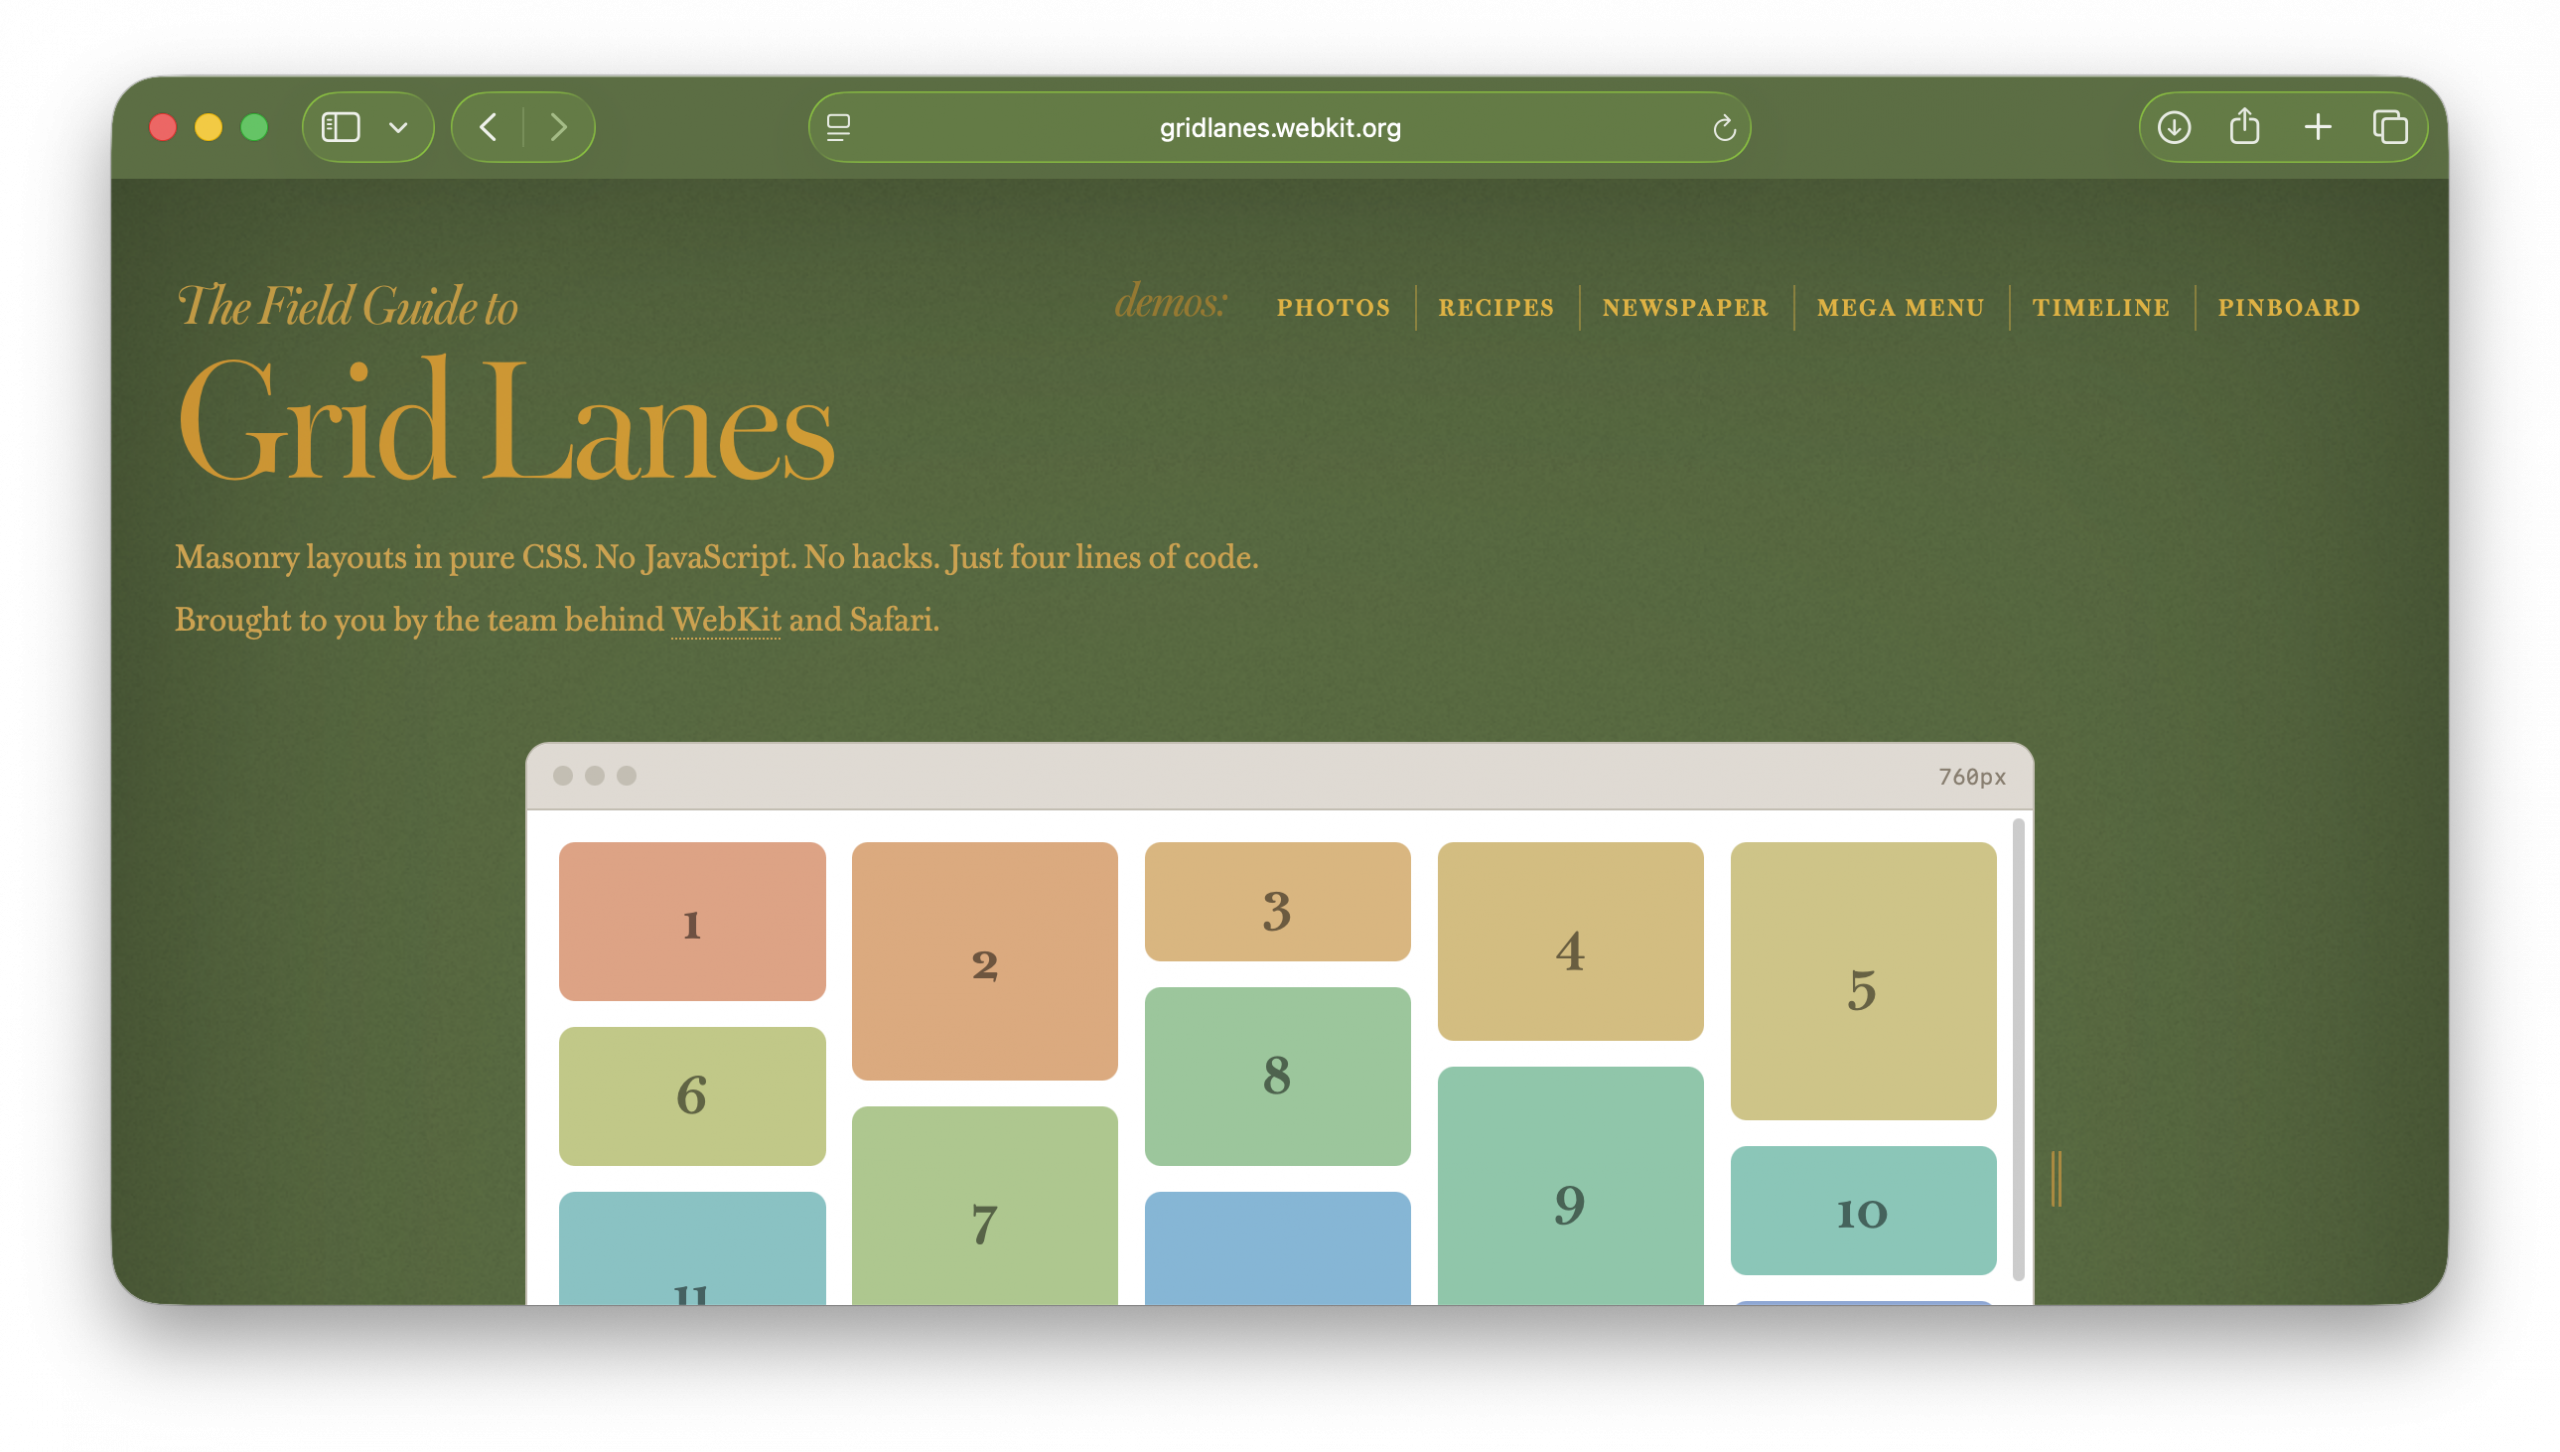
If you ever bookmarked the CSS Tricks Complete Guide to Flexbox, HTML5 Rocks, or CSS Zen Garden, a guide like this might feel familiar. It’s designed to be an easy introduction, a reference guide — and just plain fun.
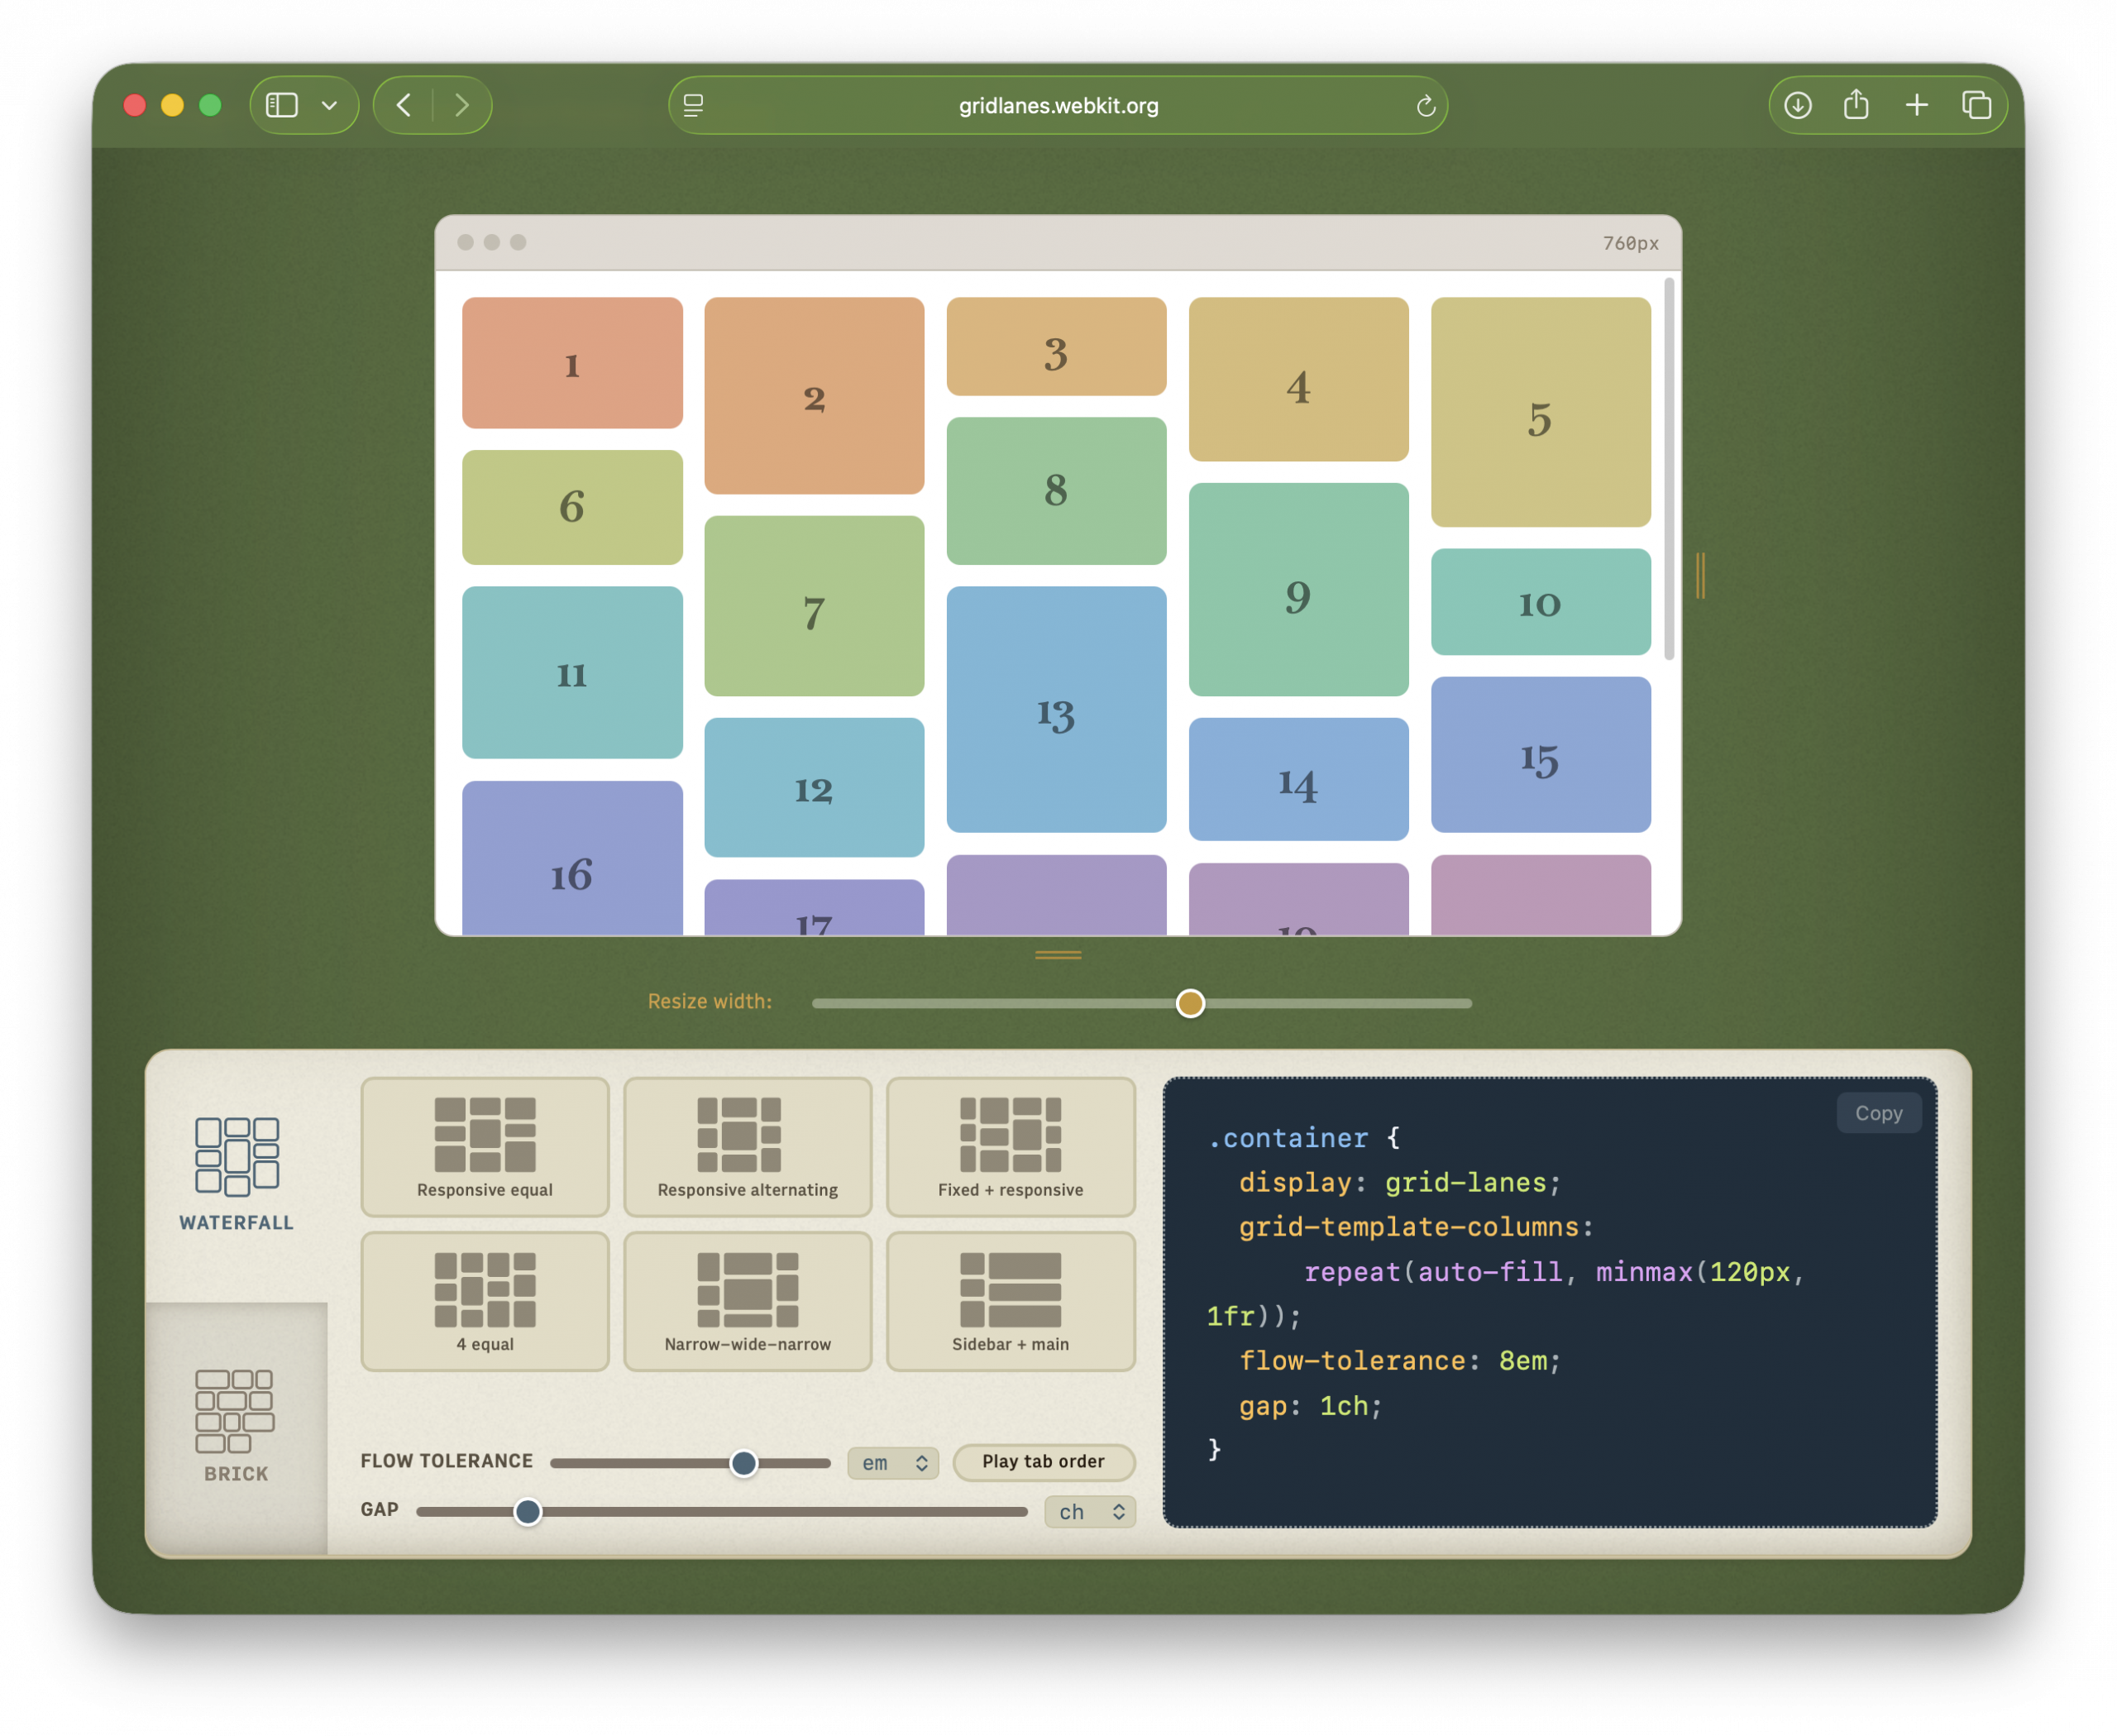
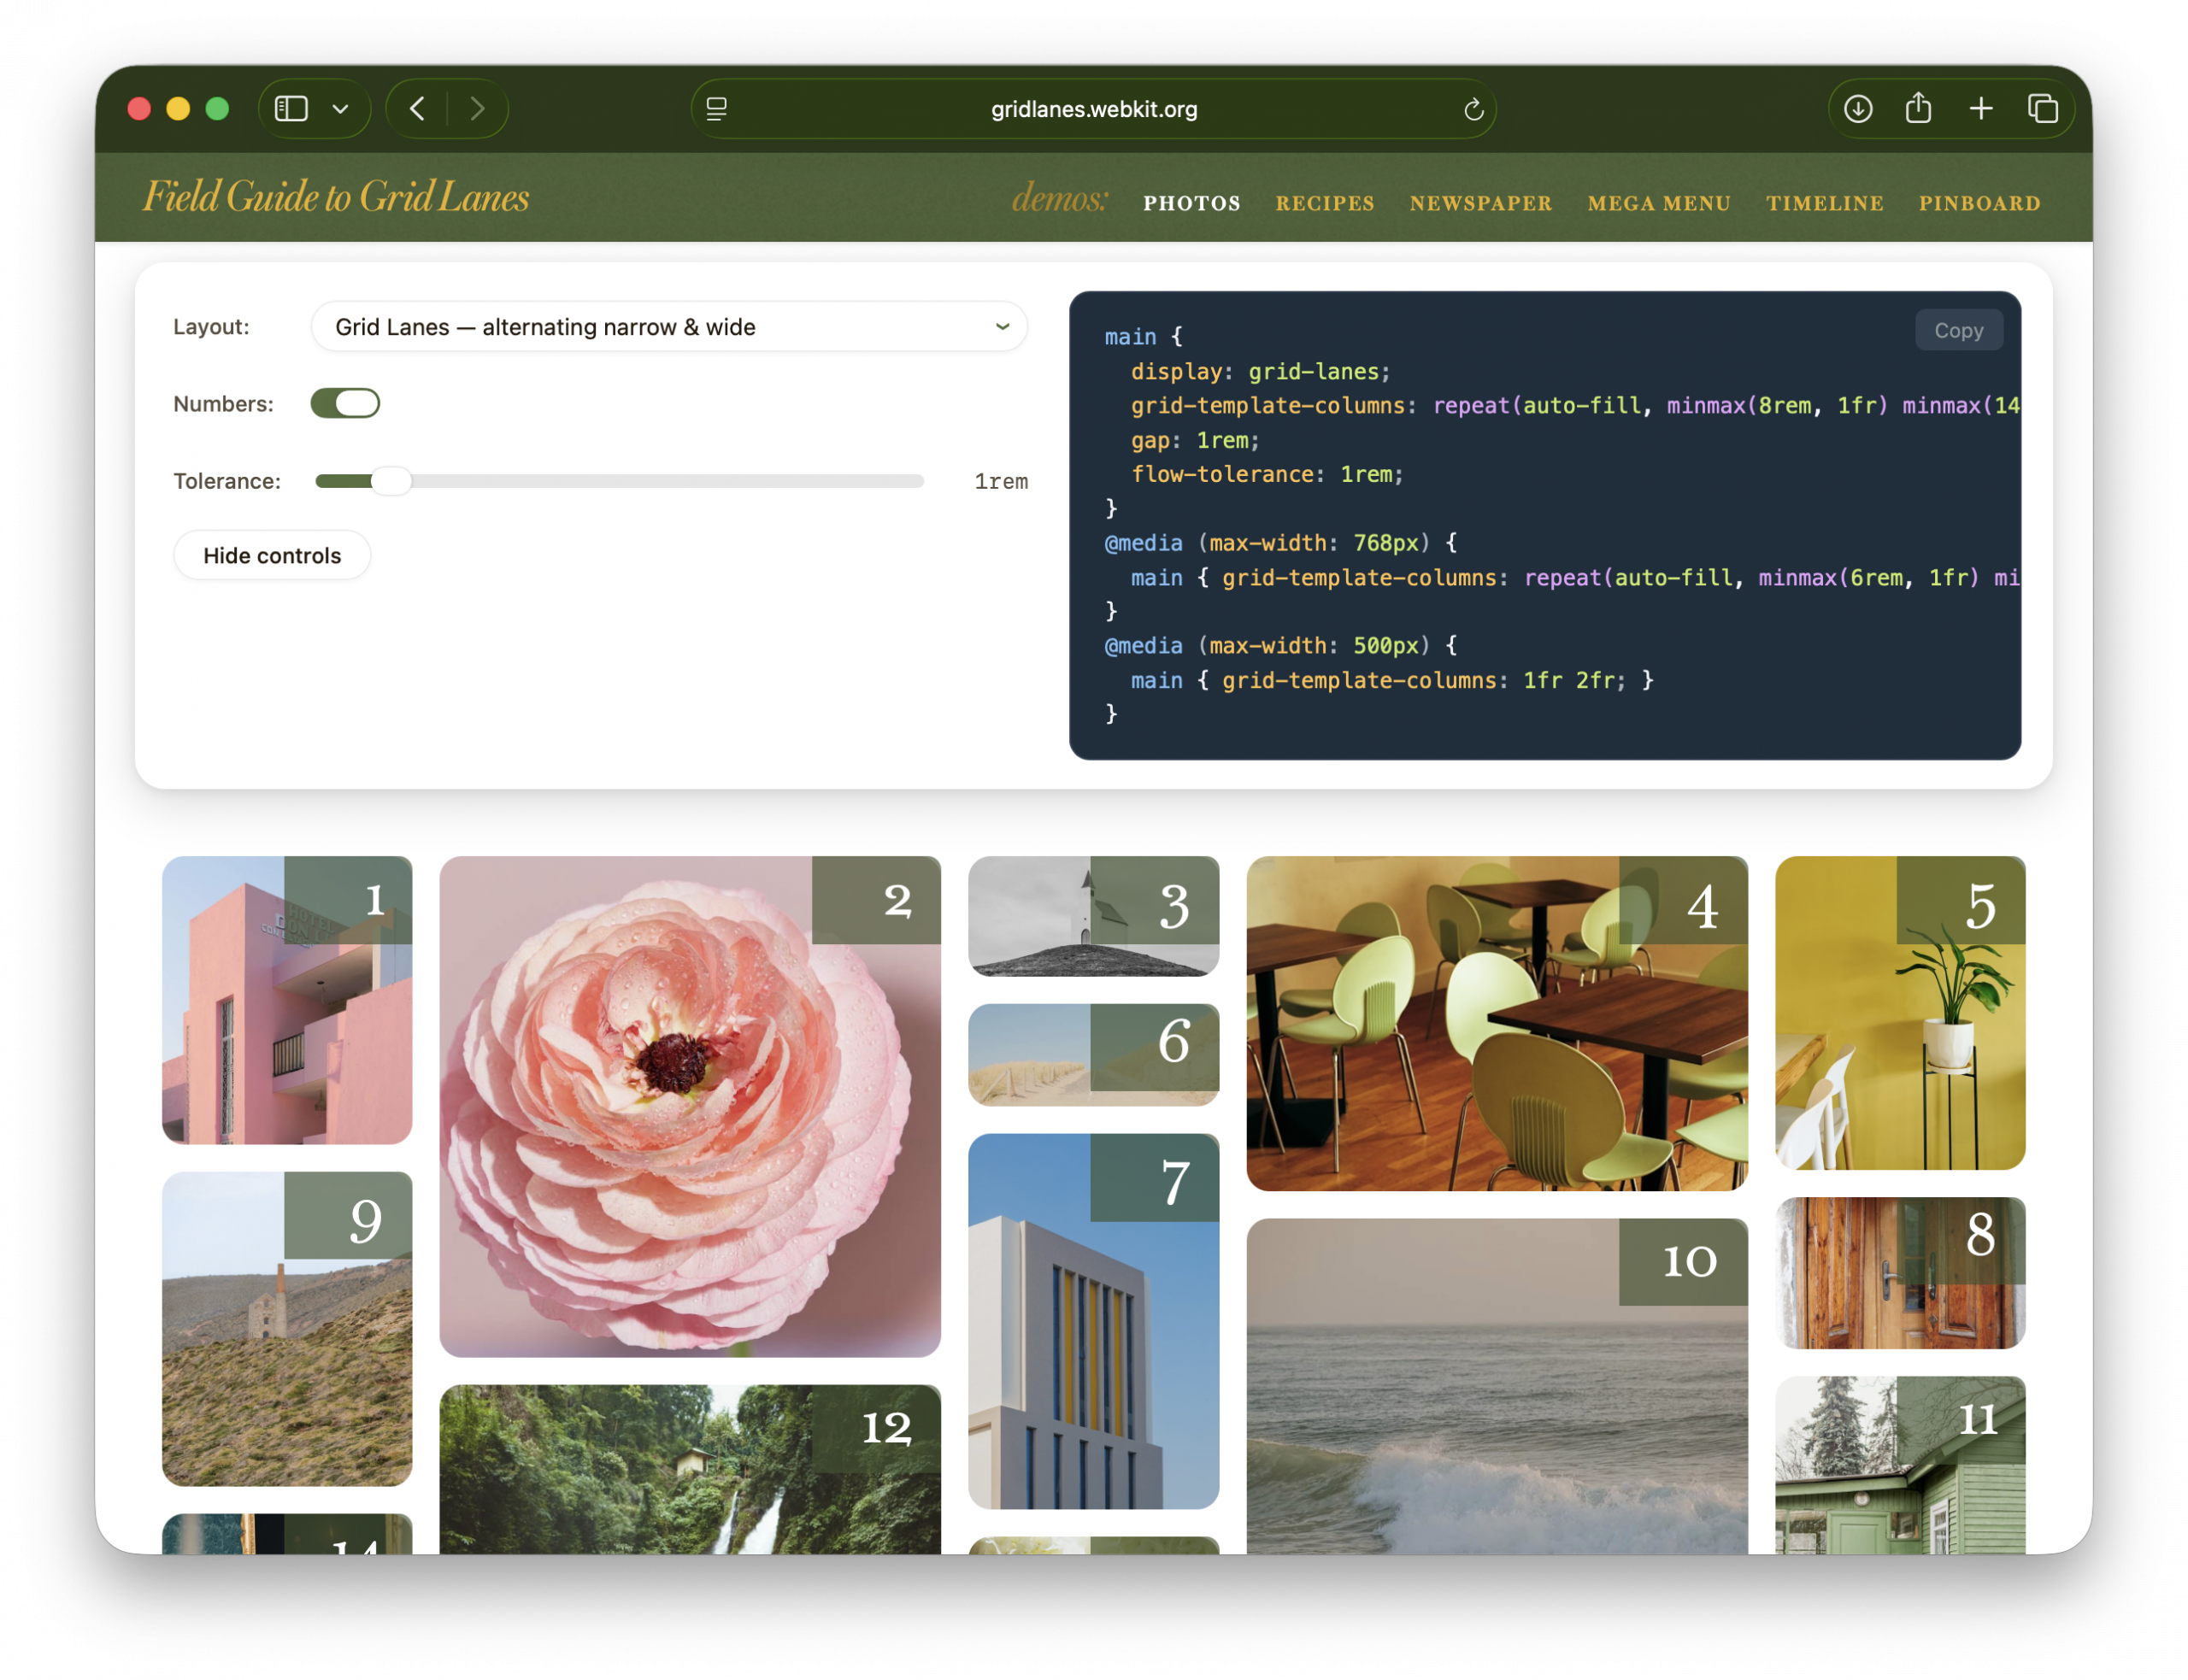
The interactive playground
At the top is a live, editable Grid Lanes layout. Switch between Waterfall and Brick. Try preset layouts. Drag the slider labeled “Flow tolerance” and click “Play tab order” to understand the impact of flow-tolerance.
Resize the demo browser window to test responsive behavior without resizing your whole window. Edit the CSS directly. Copy the code you create.
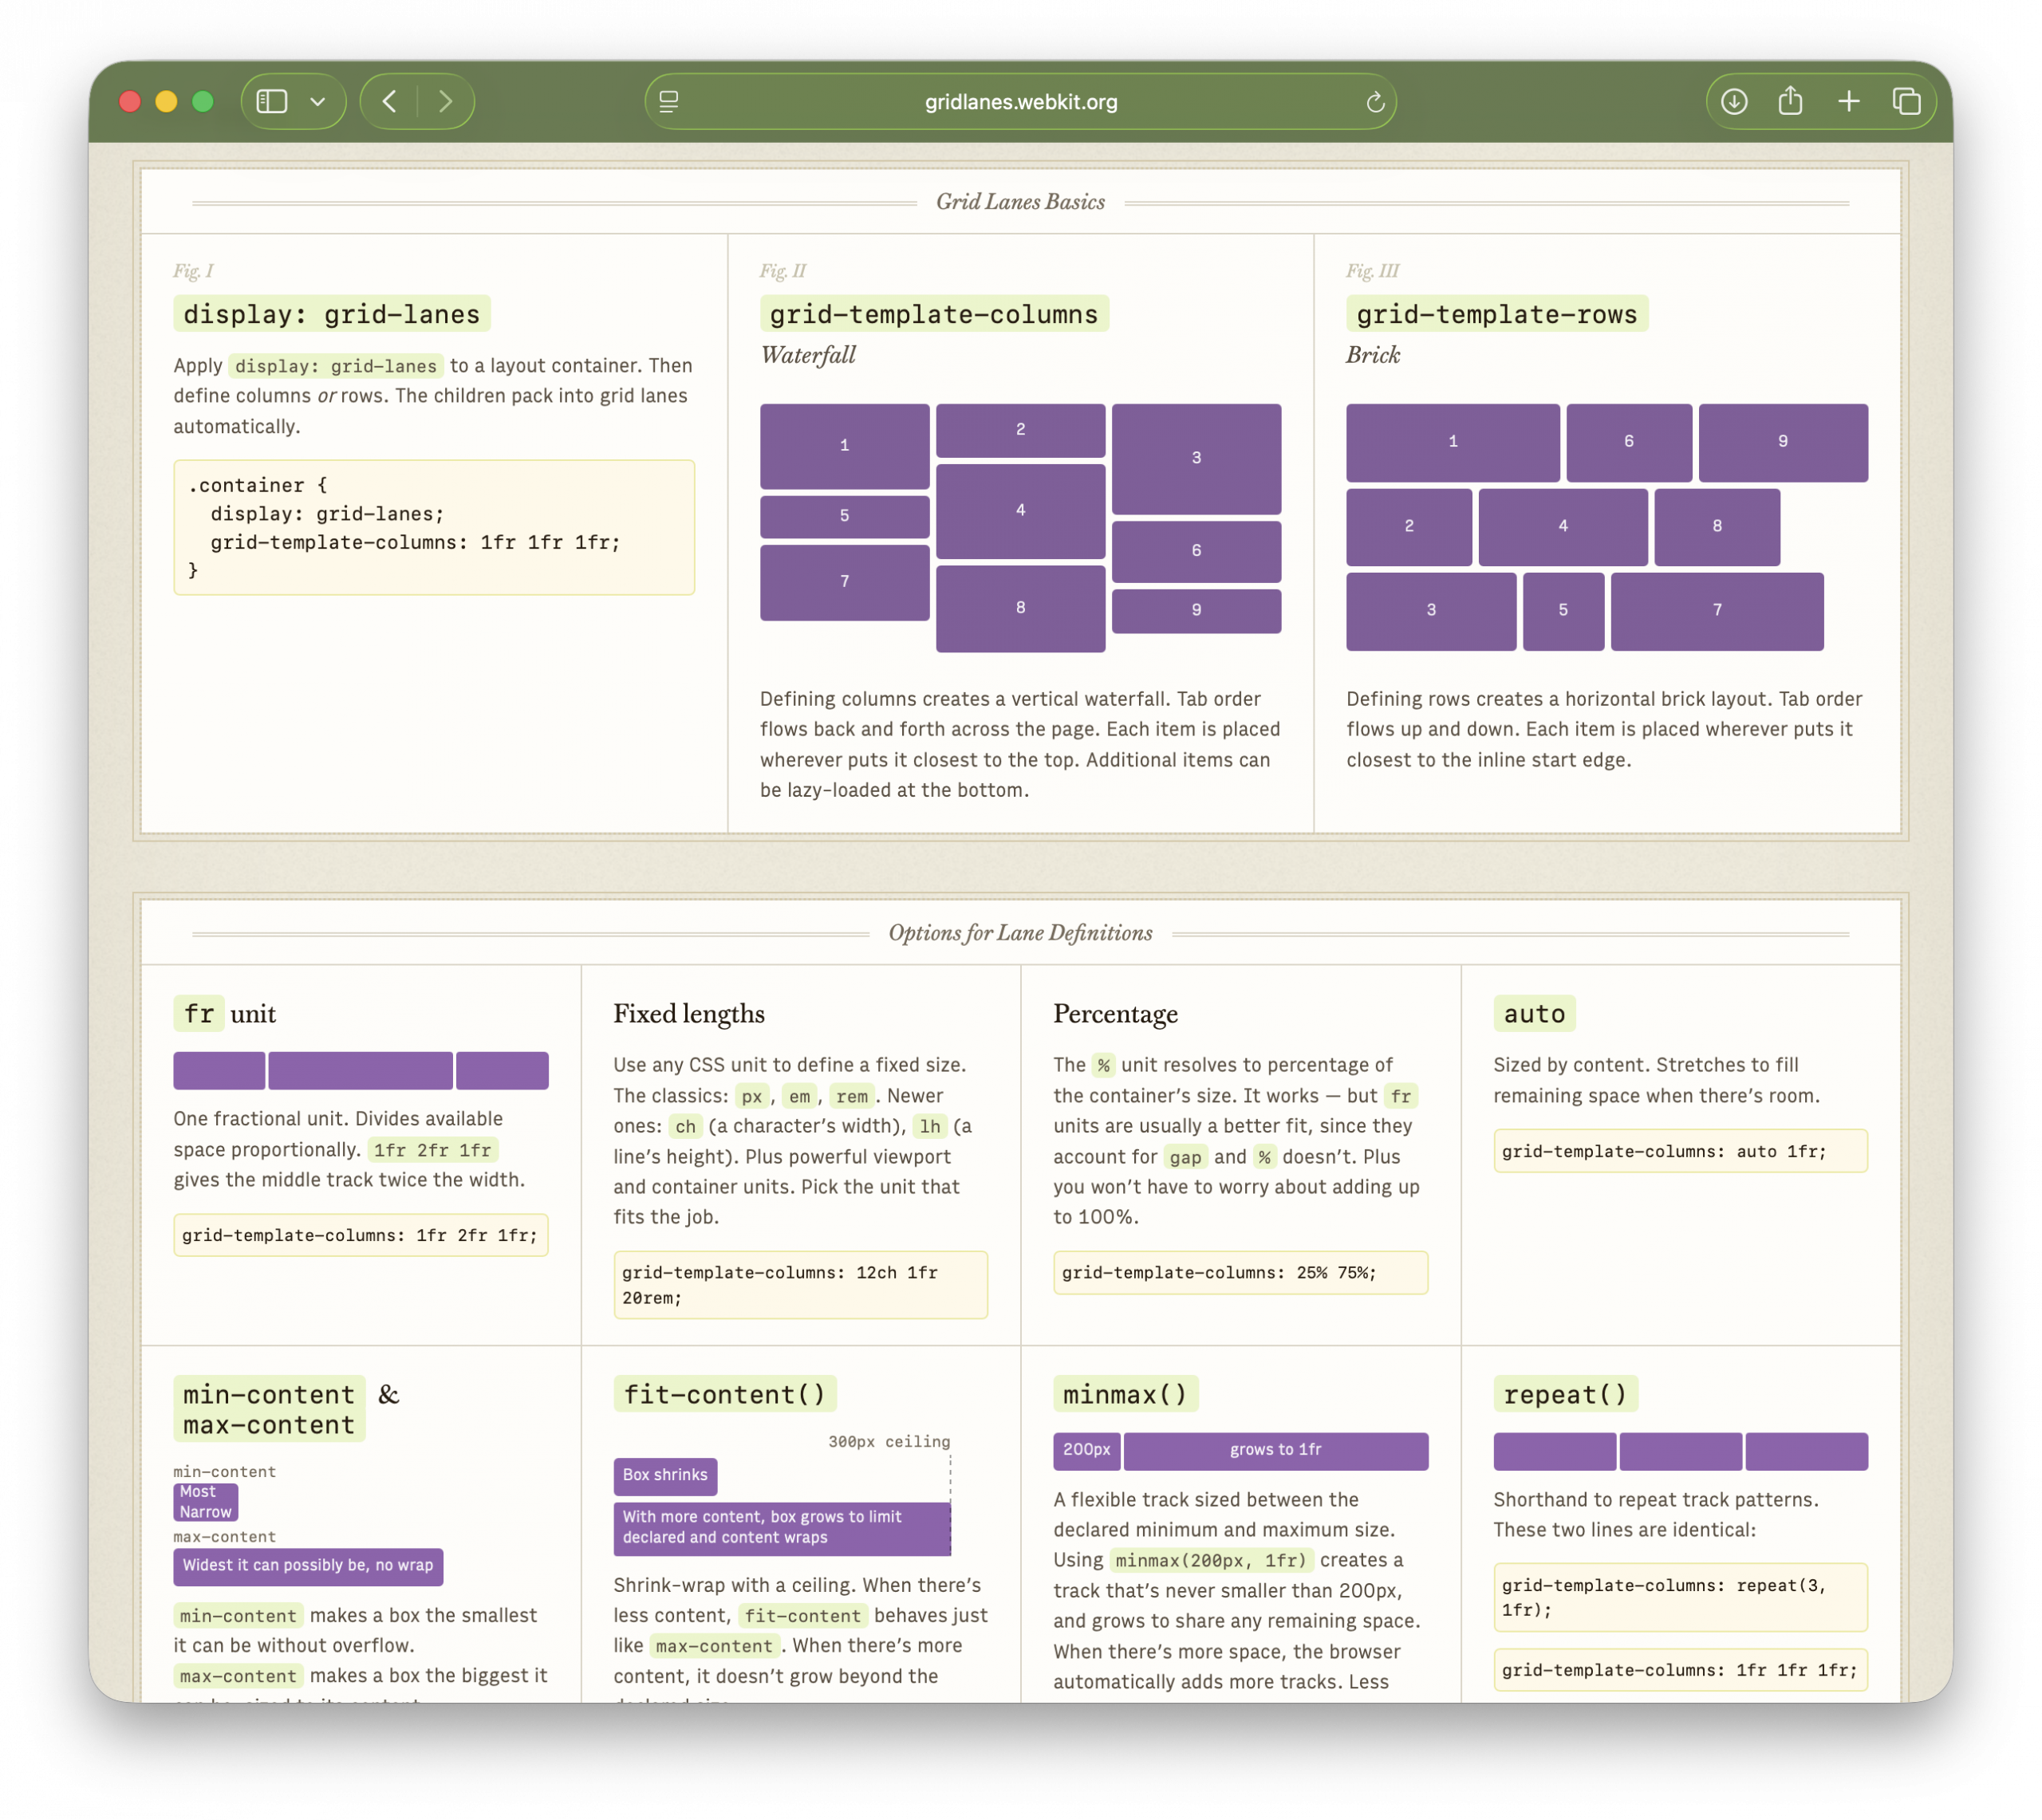
The cheat sheet
Next is the Field Guide itself — a single-page reference for every property, value, and option.
It has four sections:
Grid Lanes Basics — display: grid-lanes, plus the difference between waterfall and brick layouts
Options for Lane Definitions — Grid track-sizing with fr units, fixed lengths, percentages, auto, min-content & max-content, fit-content(), minmax(), repeat(), and auto-fill vs auto-fit
Options for Placement & Spacing — flow-tolerance, gap, spanning tracks, and explicit placement
Good to Know — info about source order, progressive enhancement, and switching layouts at different breakpoints
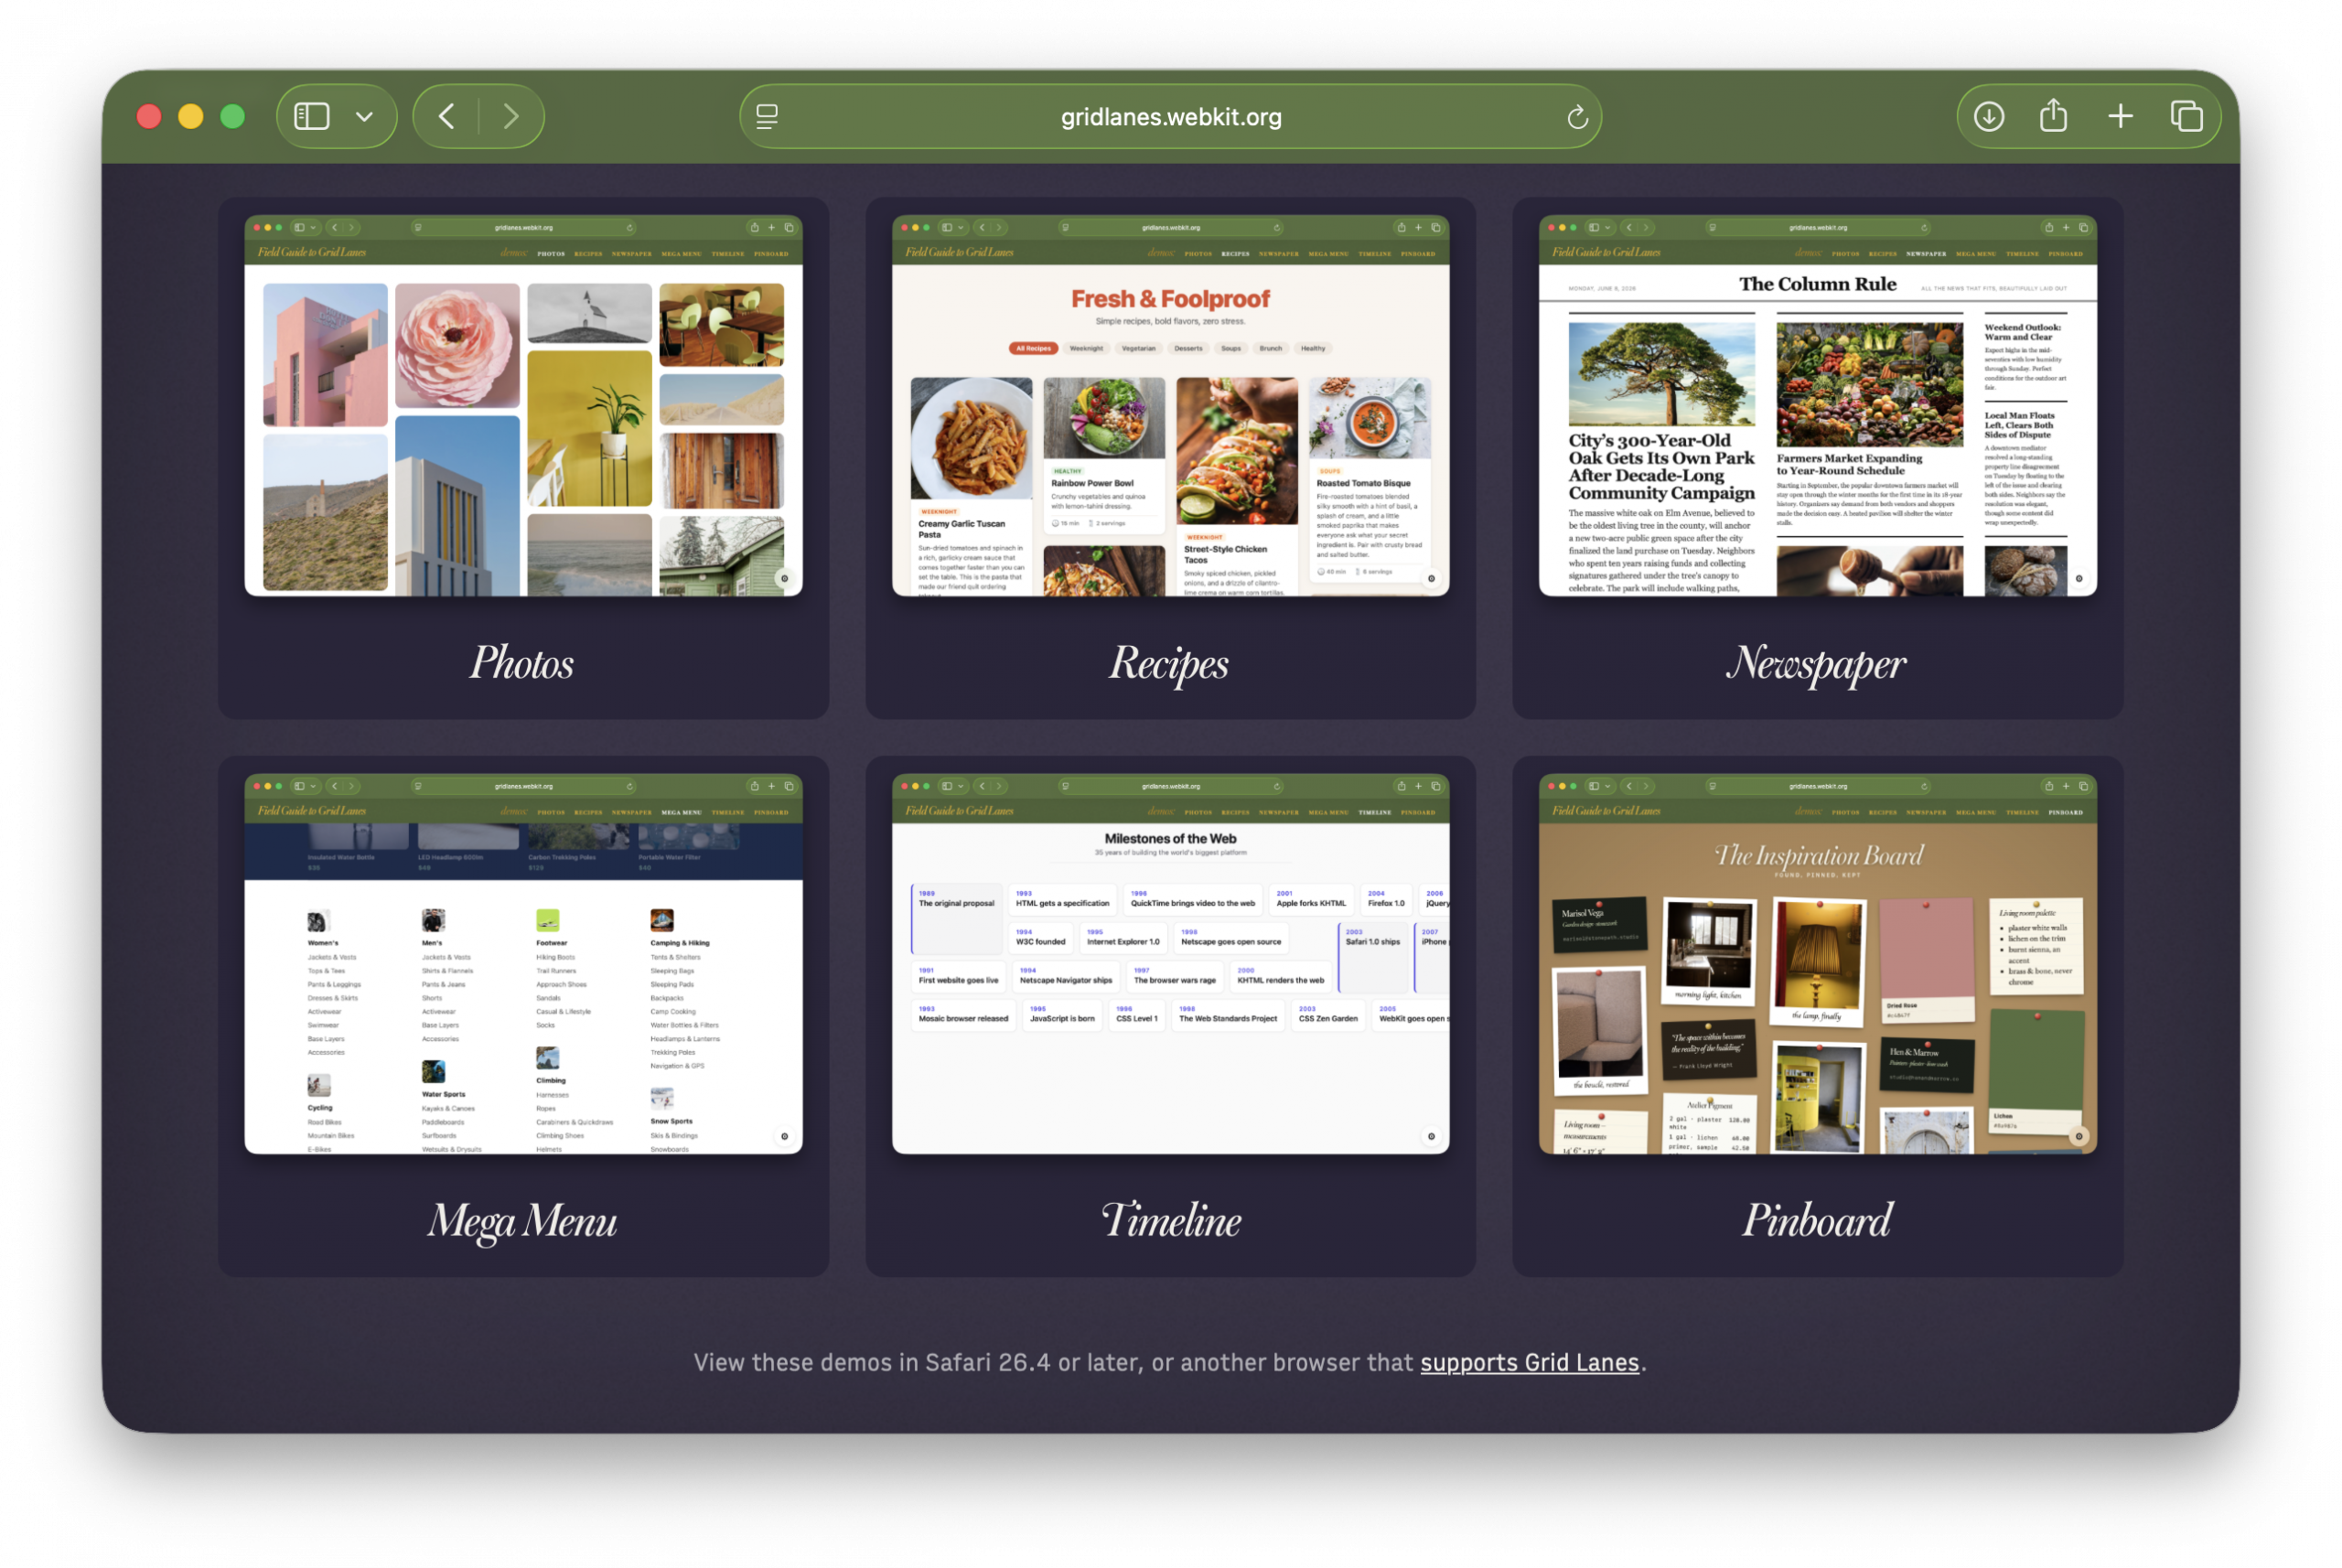
The demos
To showcase the possibilities of Grid Lanes, we created six demos, each available in several variations:
Photos — just images, in a variety of aspect ratios
Recipes — components containing both flexible images and varying lengths of text
Newspaper — longer passages of text, with a few images (and a lot of CSS puns)
Mega Menu — lists of very short text
Timeline — text in brick layout
Pinboard — mixed media
Each demo opens with a floating control panel.
“Layout” offers a dropdown of variations — showing off what Grid Lanes can do, and comparing it to Flexbox, Multicolumn, and Grid. “Numbers” shows item order. “Flow tolerance” lets you experiment with its effects. The code panel displays the key layout CSS.
“Hide controls” puts the focus on the demo itself. To get the controls back, click the gear that appears in the lower-right corner.
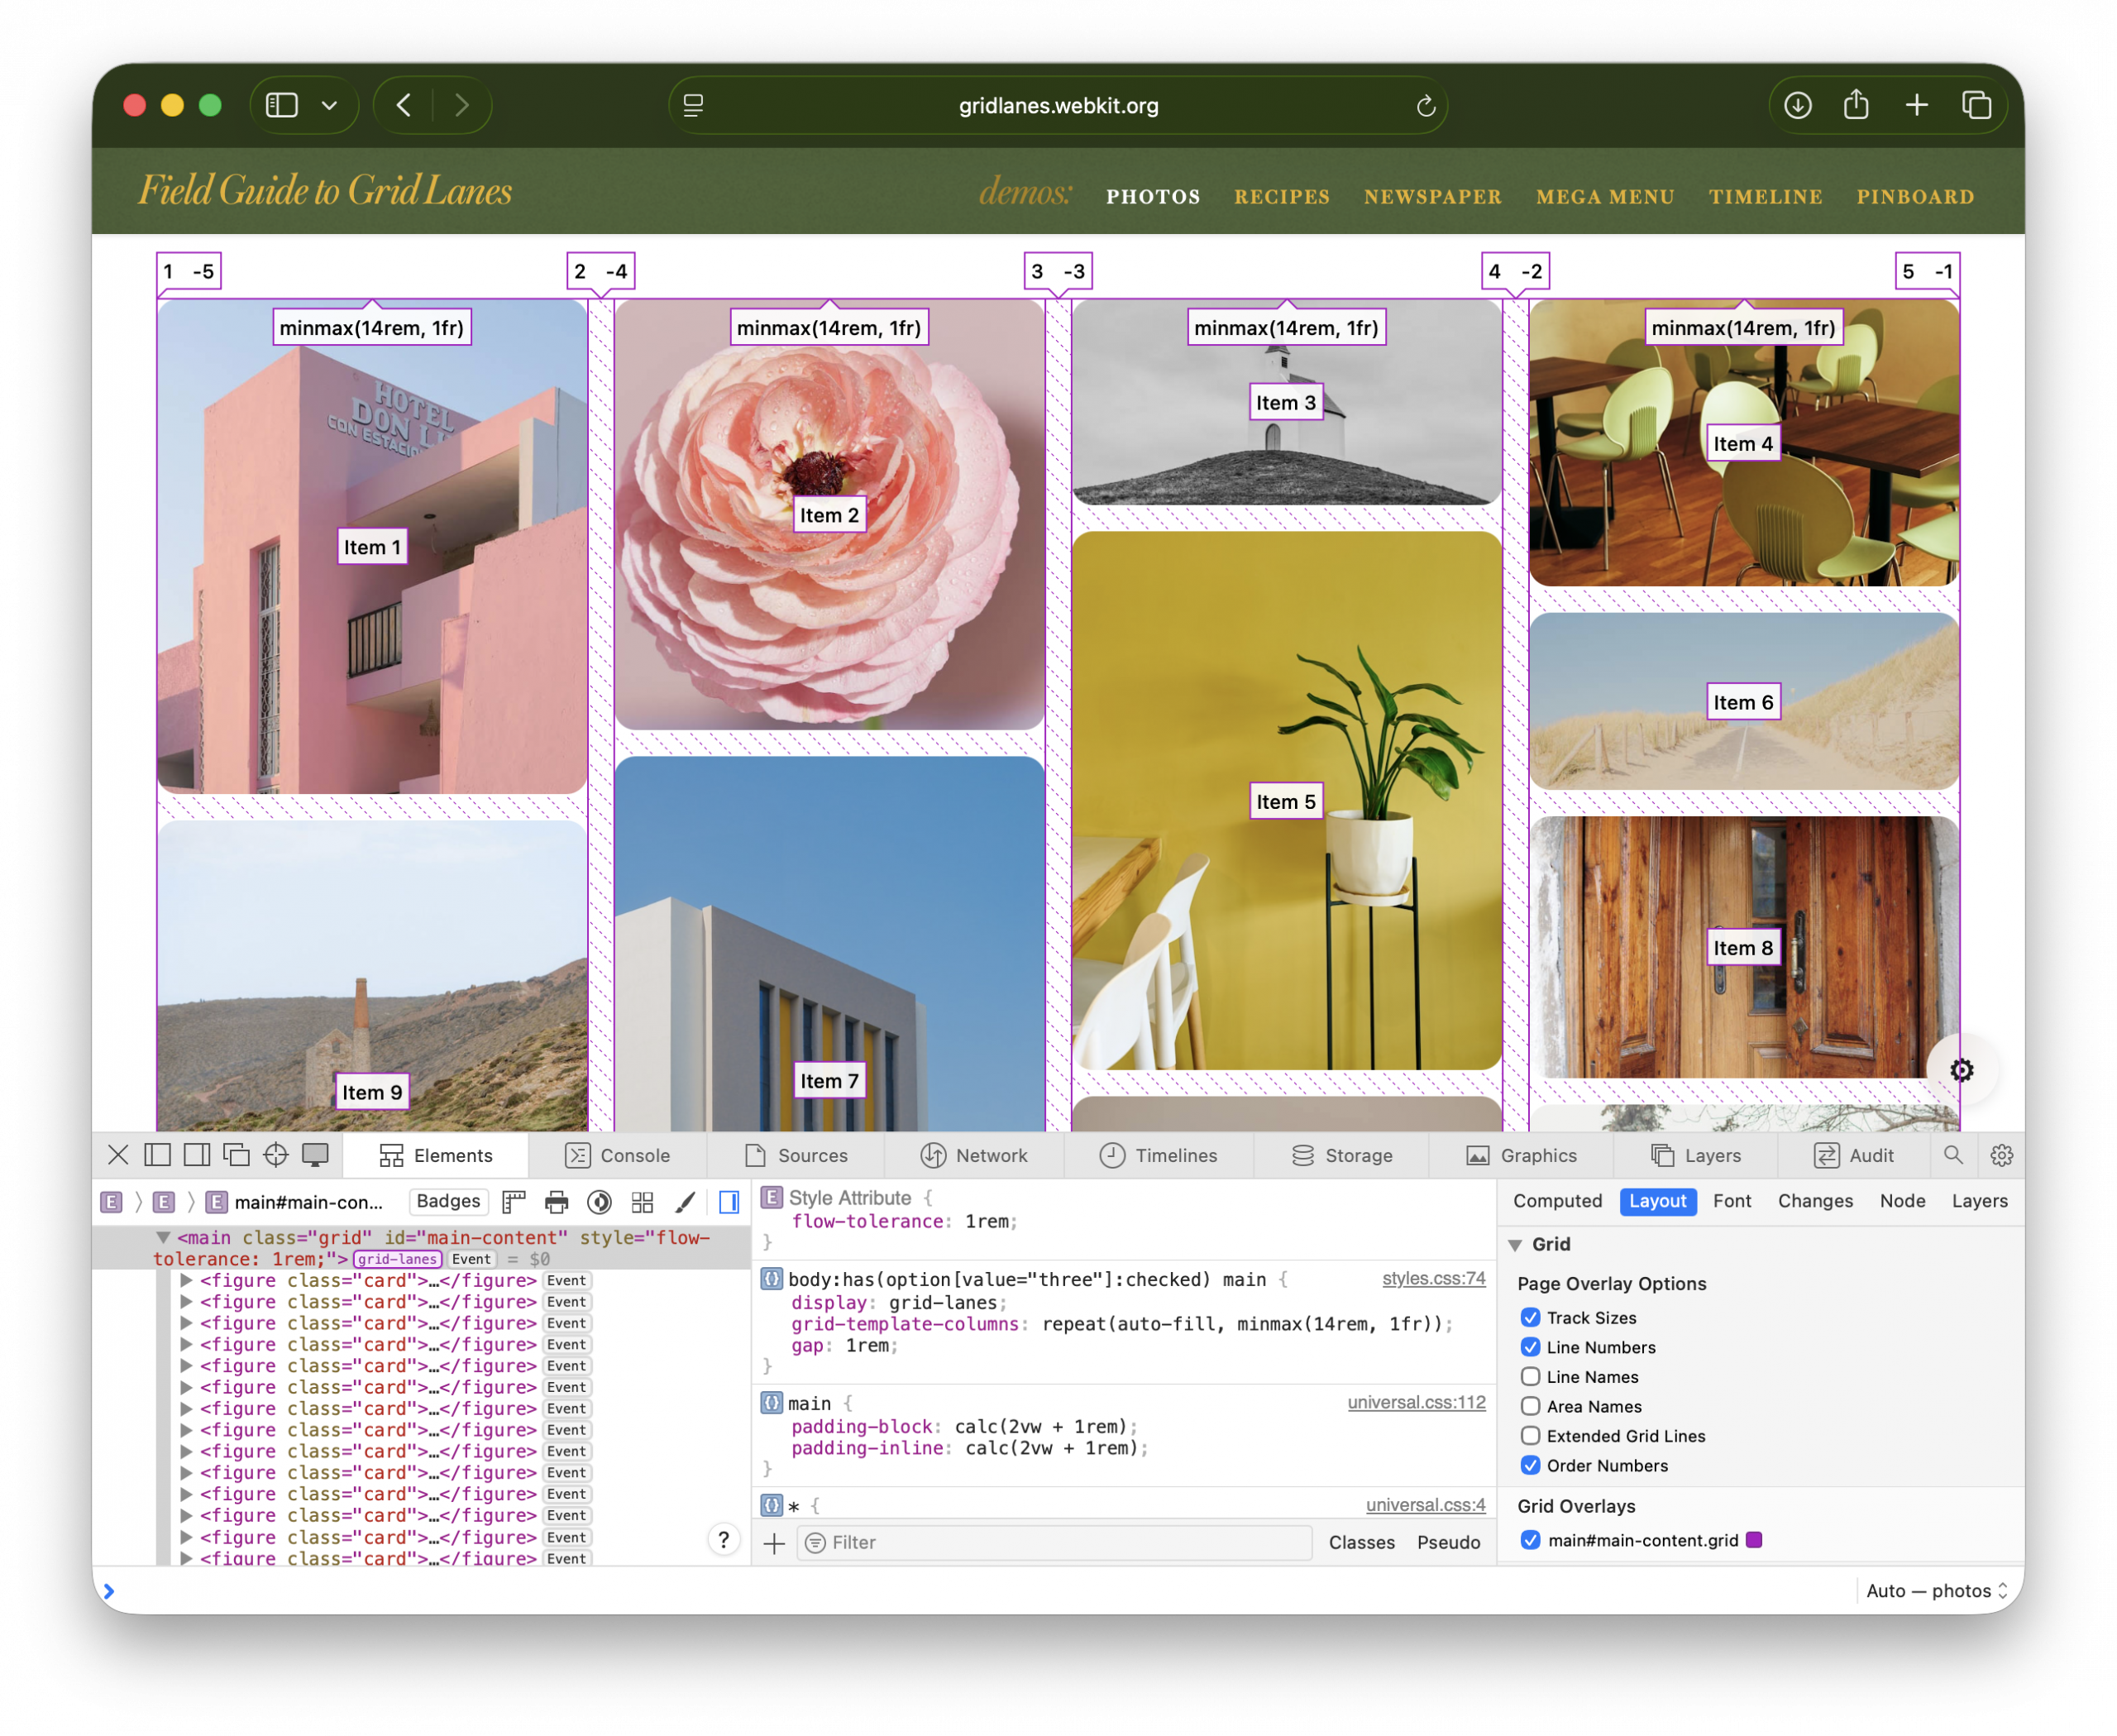
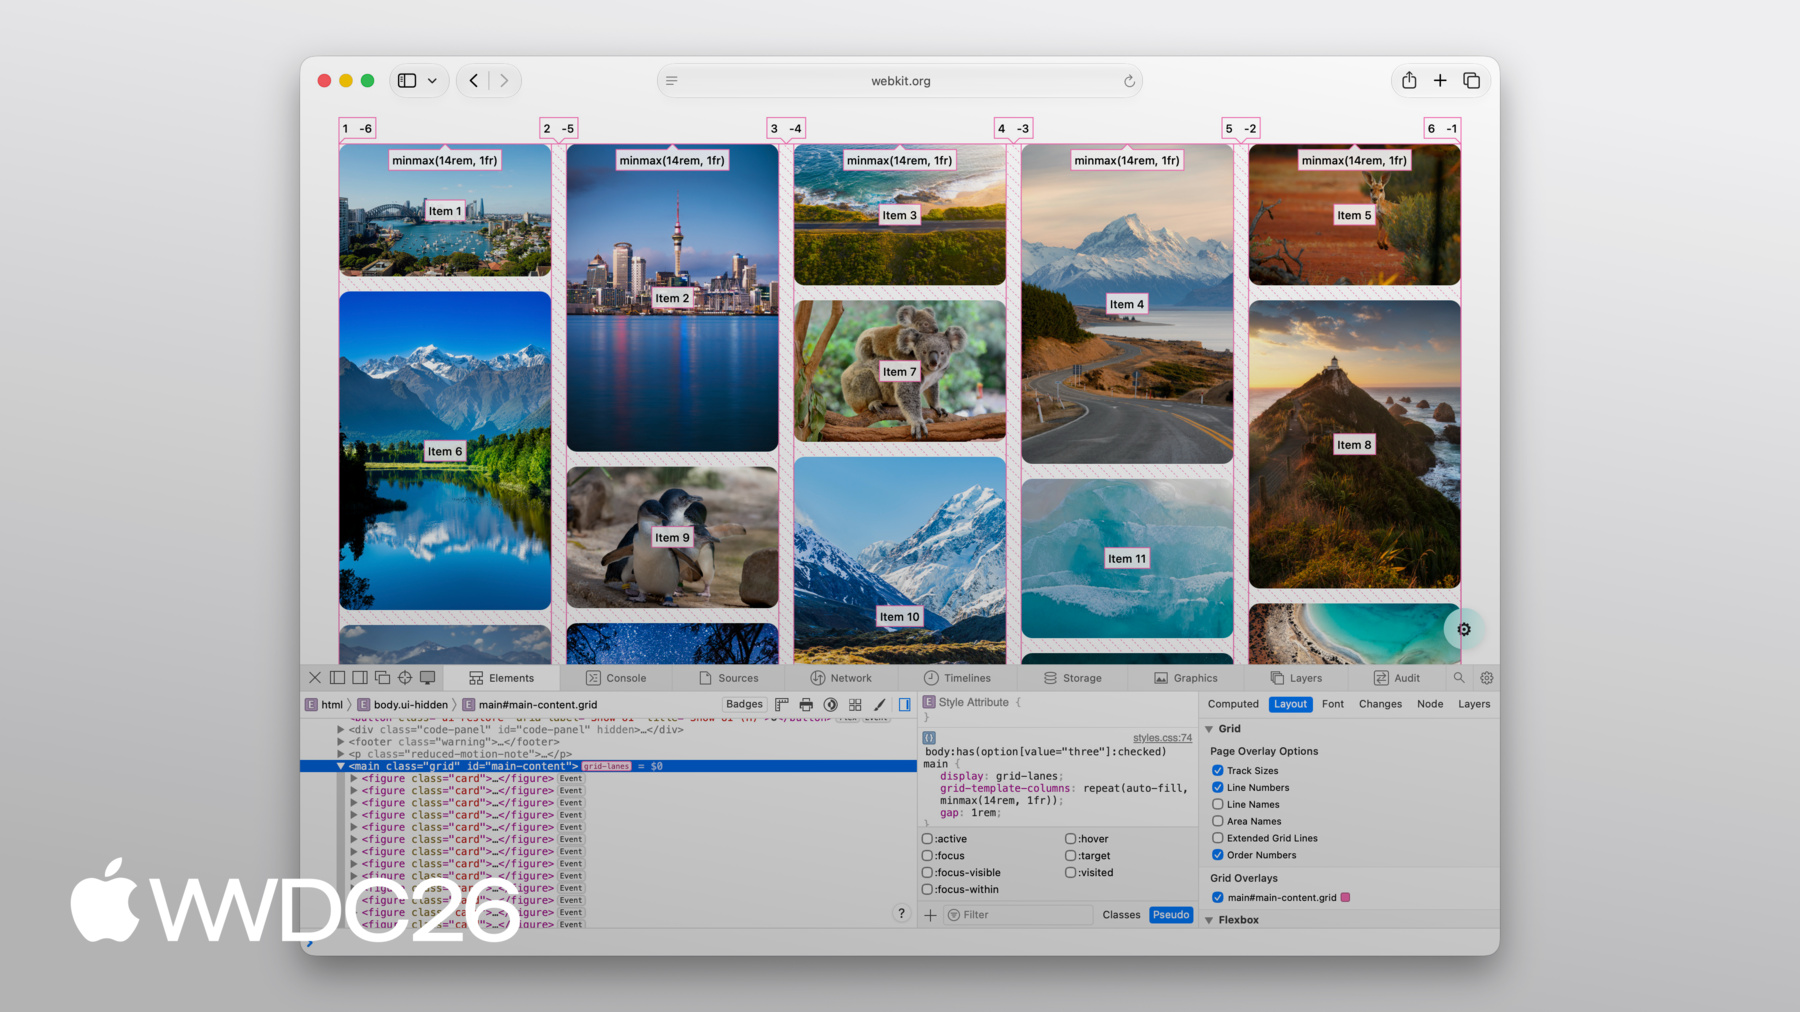
Working with Safari’s developer tools
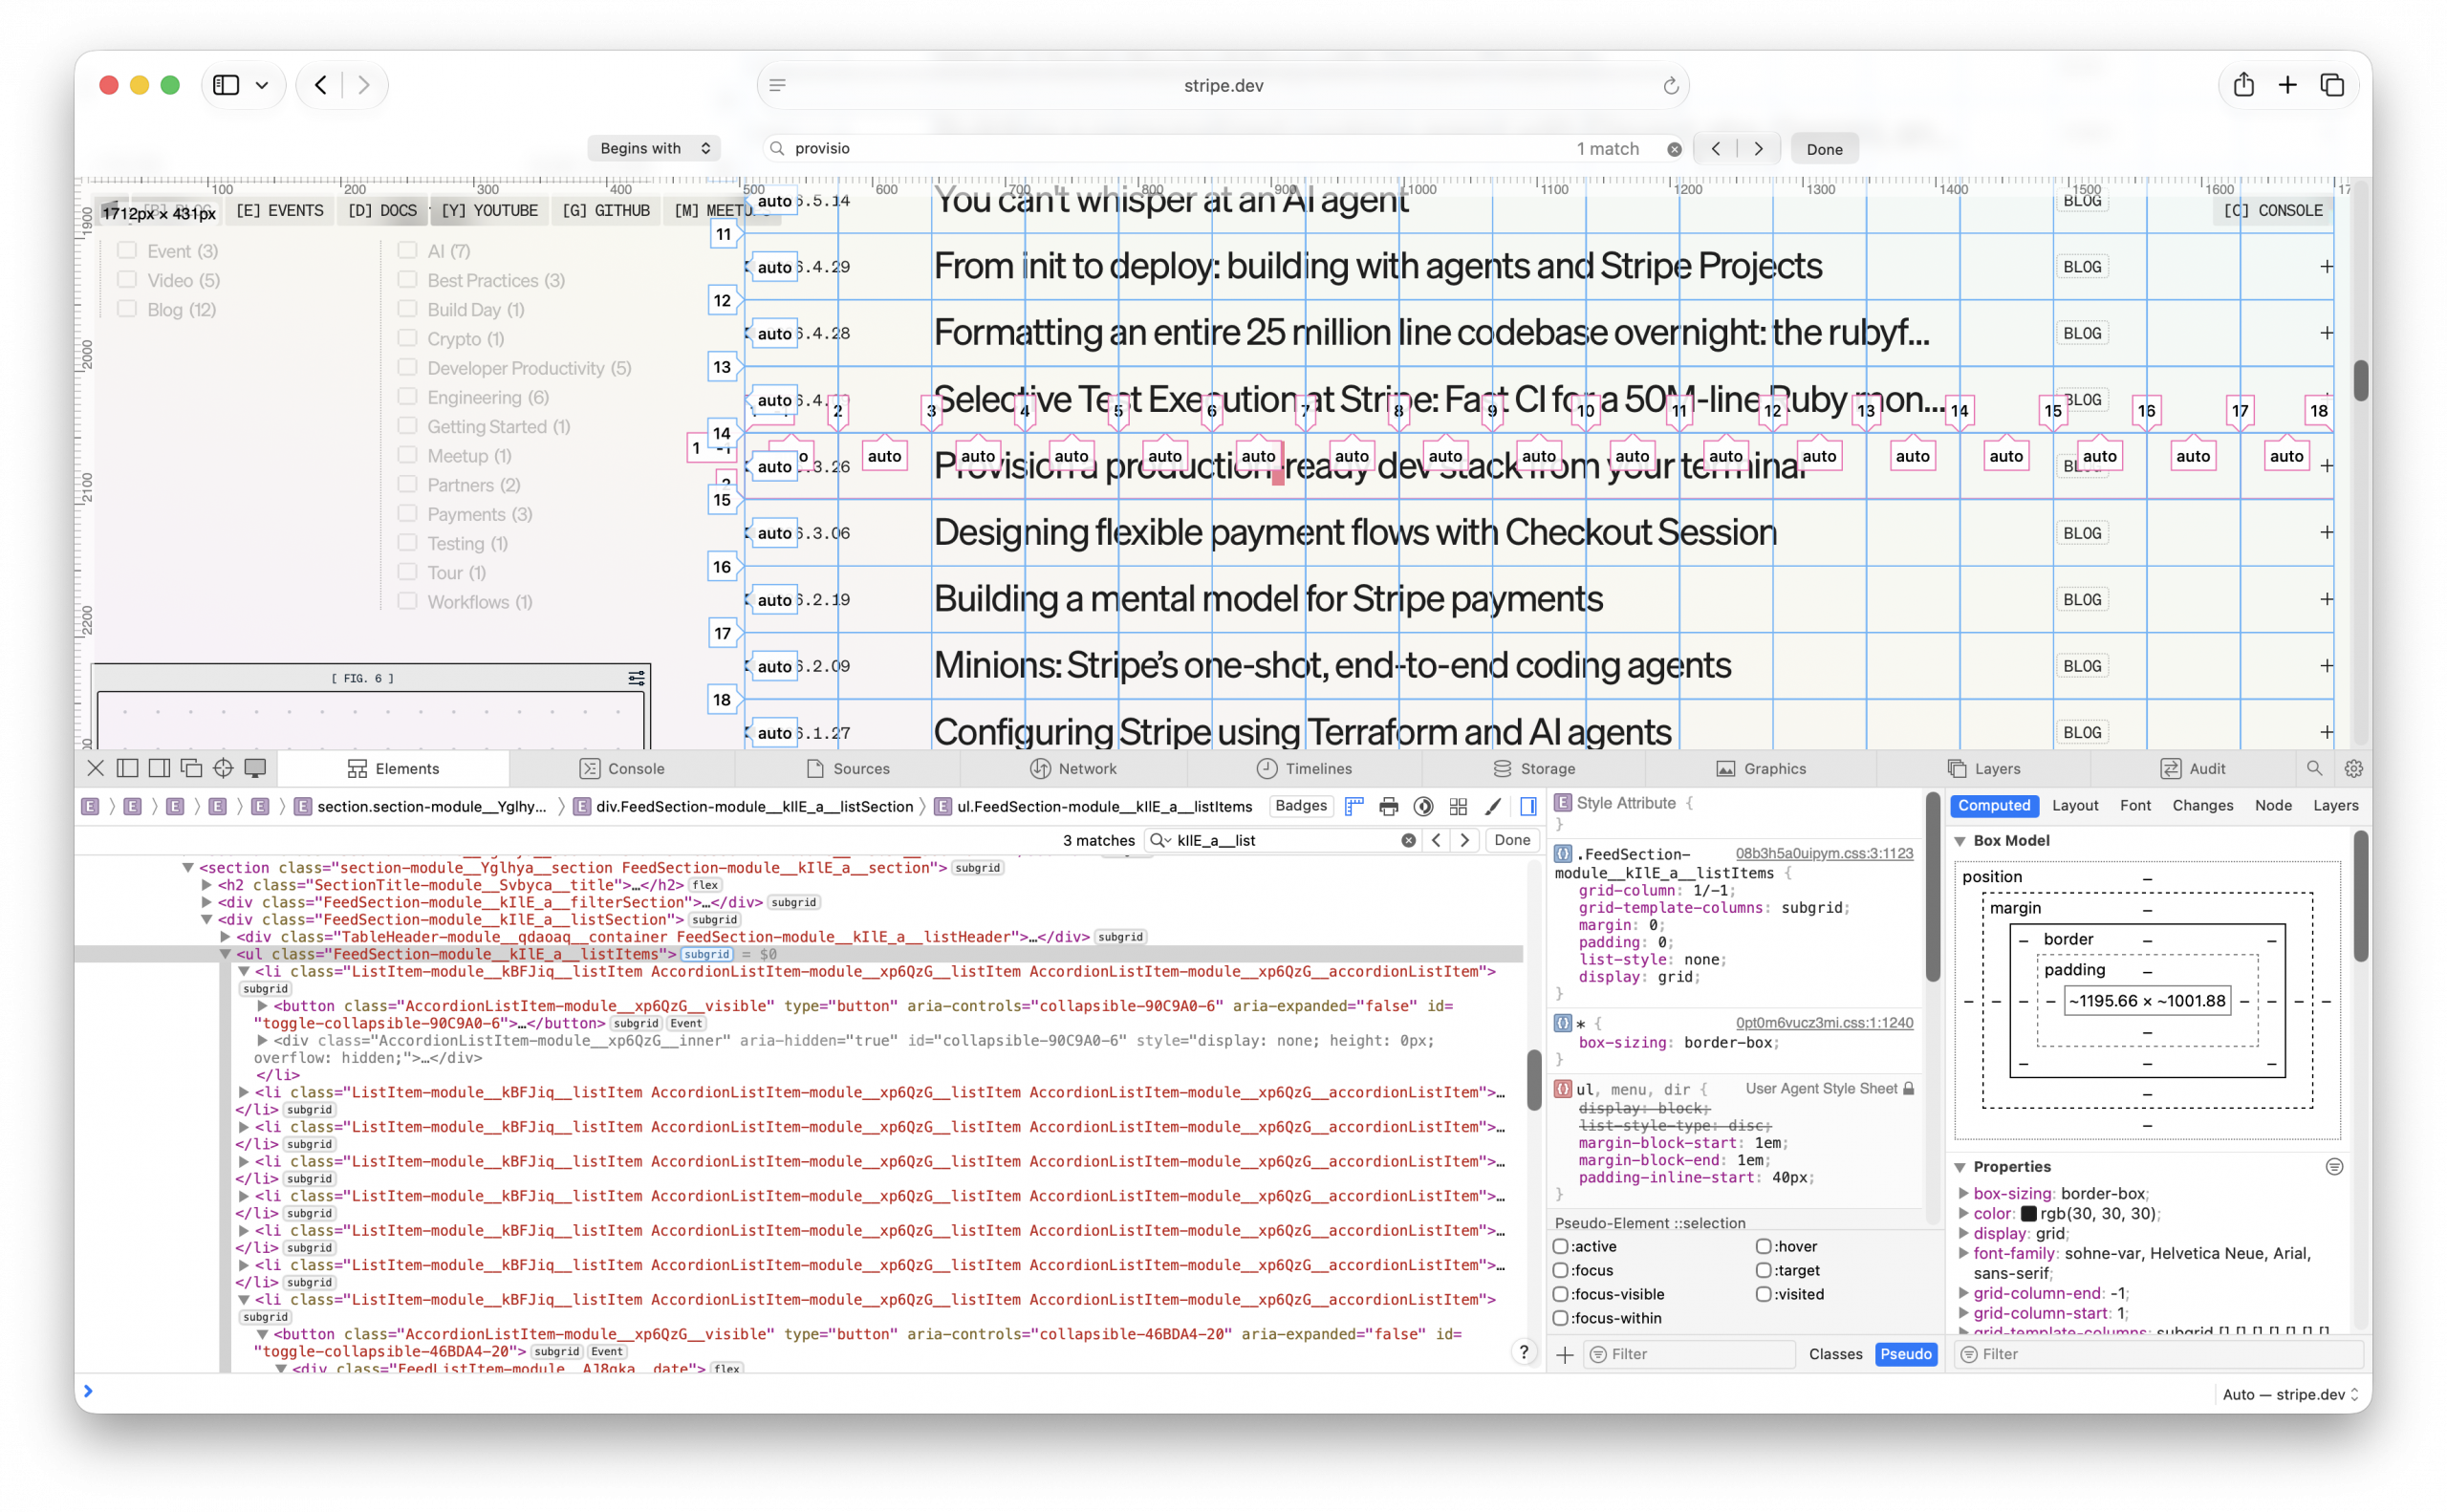
Web Inspector knows about Grid Lanes, too. Toggle “Order Numbers” to reveal overlays marking the DOM order of items. These numbers are extremely useful when experimenting to find the best flow-tolerance value for your content.
The Field Guide was built by the same team behind Grid Lanes. We hope this is a fun experience that makes Grid Lanes easy to learn. Bookmark it, share it with colleagues, and let us know what you make.
MapKit JS allows you to bring the power and simplicity of Apple Maps to your website or web app. Whether you’re building a store locator, a travel planner, or a companion web experience for a native app, MapKit JS offers you a robust, privacy-first framework, providing the mapping data, services, and design quality behind Apple Maps, directly to your JavaScript code.
If you haven’t tried MapKit JS lately, now is a great time to take another look. With our latest version 6 release, we’ve made it easier than ever for you to integrate MapKit JS into your apps and websites by modernizing around today’s web development patterns.
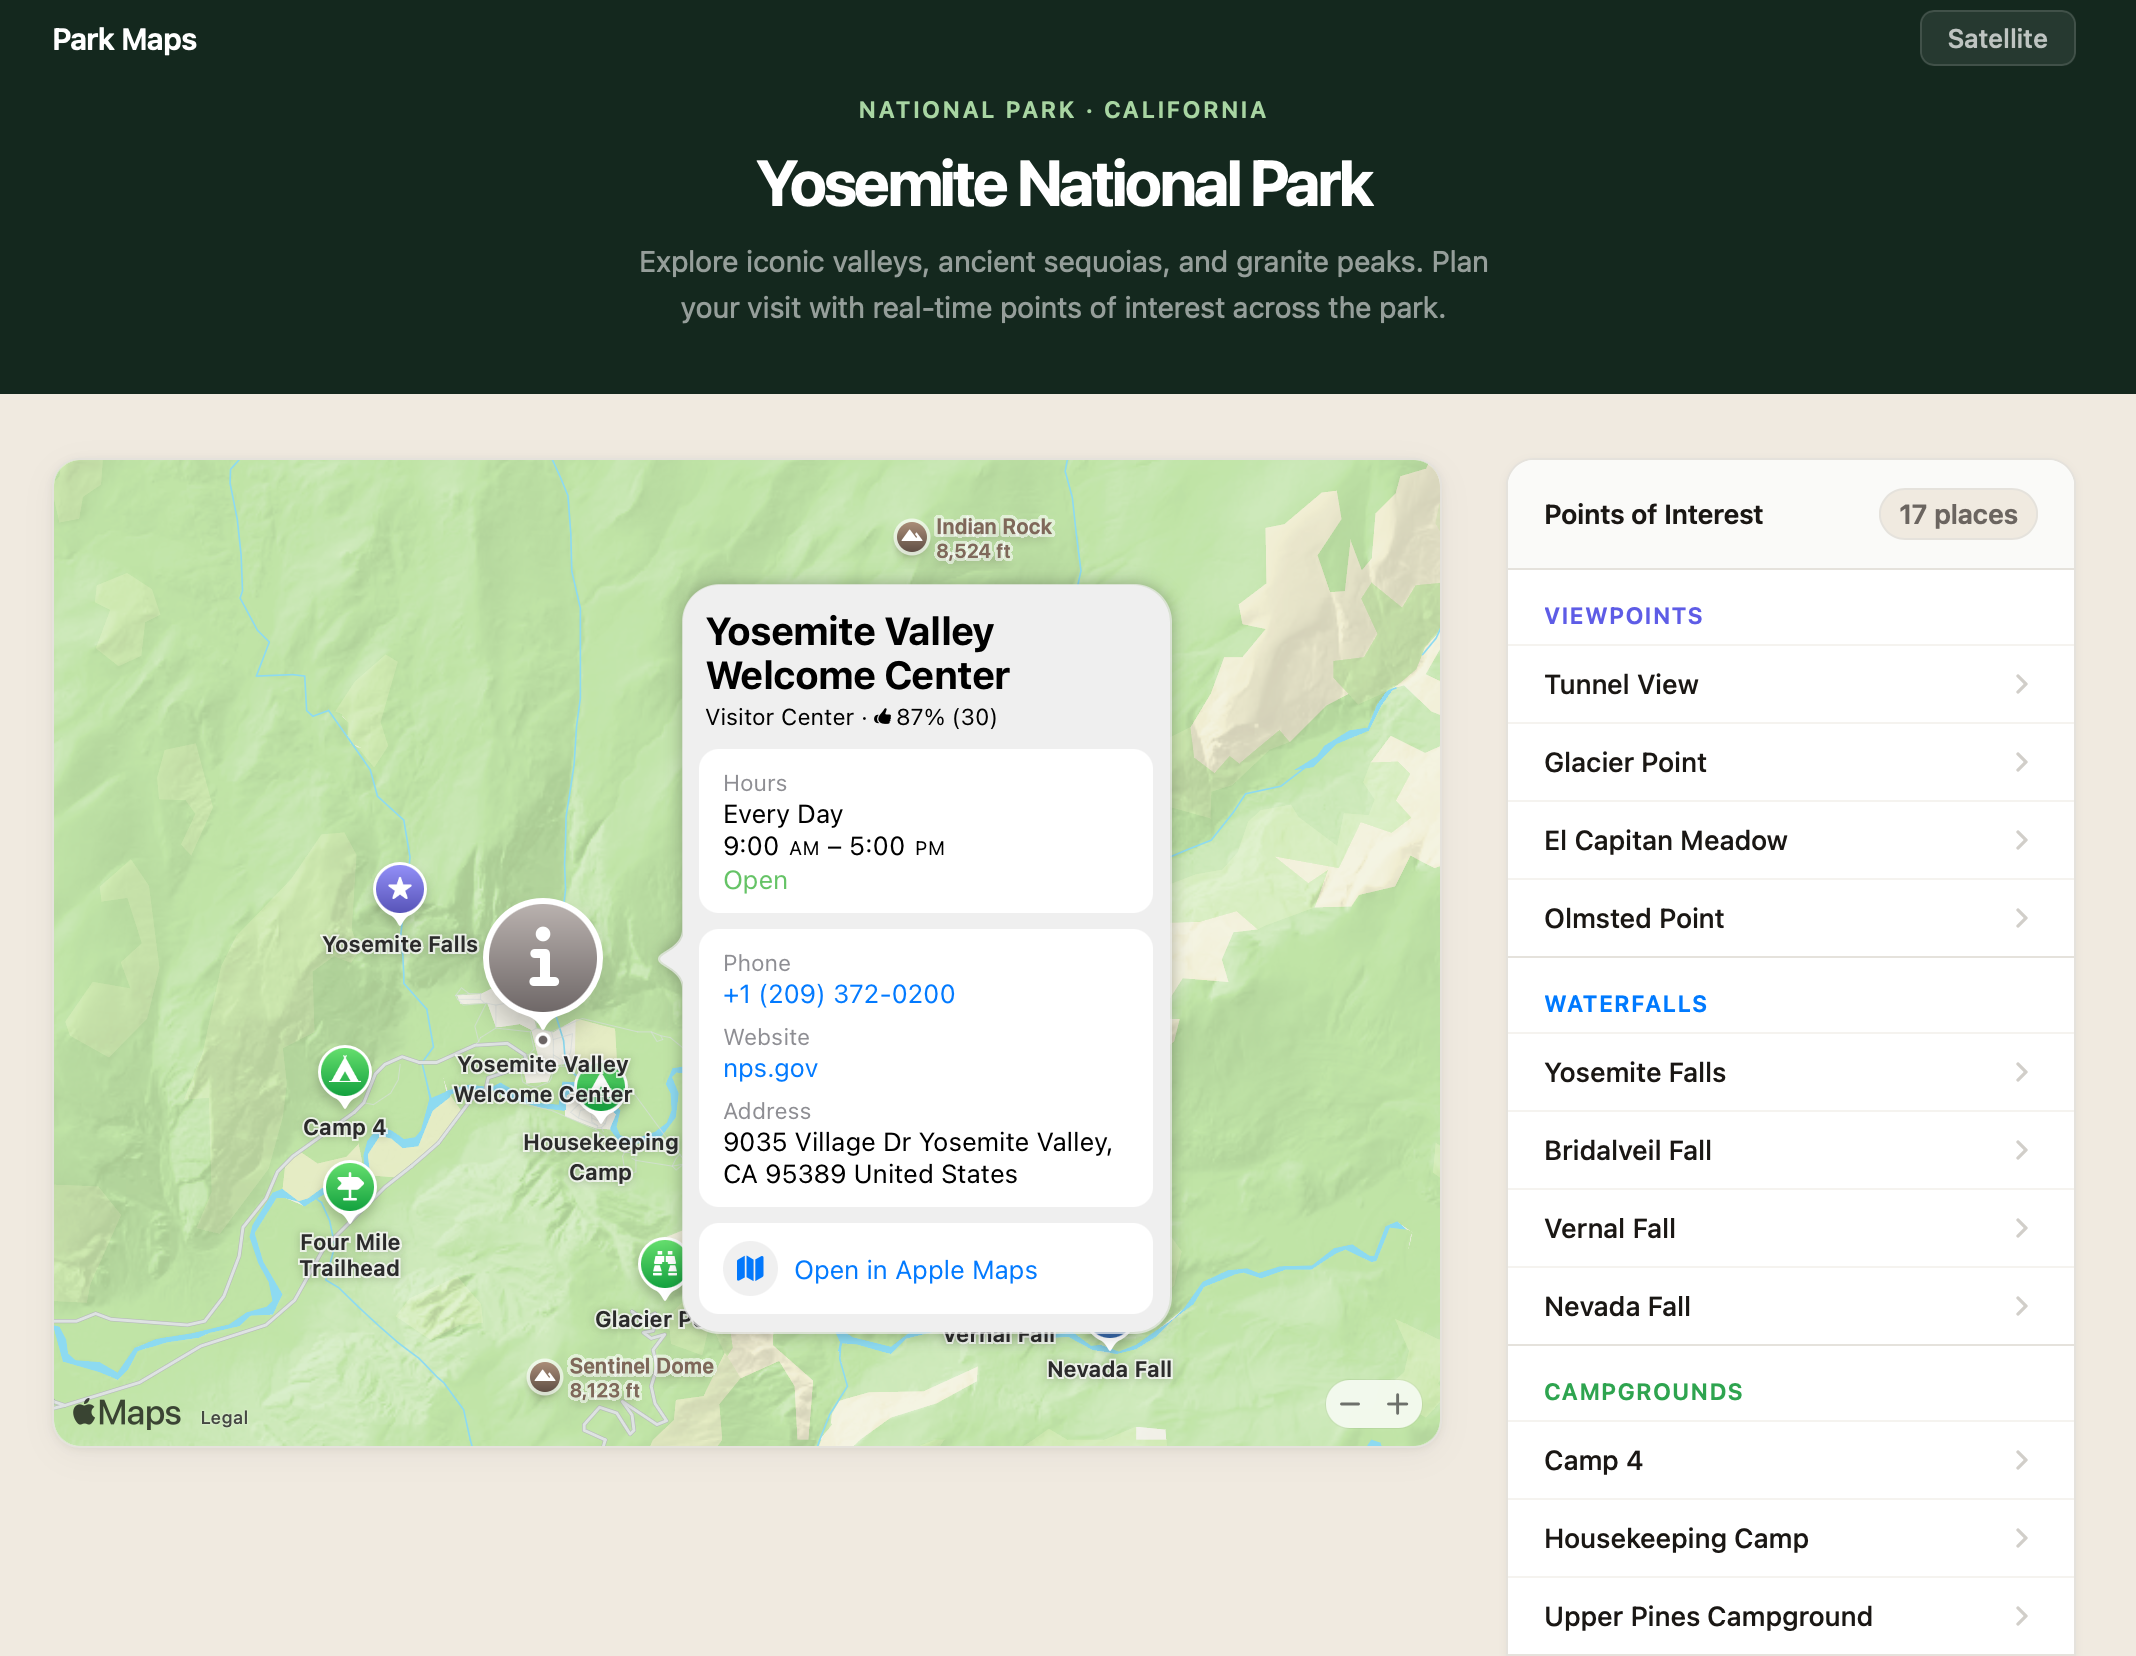
See It in Action
Getting a MapKit JS map onto a page takes a few lines of code. In this post, we’ll guide you, step-by -step, through how to build a sample app — Yosemite Explorer — featuring points of interest across Yosemite National Park in California. Explore the demo.
Try it yourself
Apple Developer Account
To display a map, provide a developer token to MapKit JS. You generate that token through an Apple Developer account — and that same account unlocks a lot more than just maps. With an Apple Developer account, you get access to Apple’s full suite of developer services: publish Safari Web Extensions, and use powerful web frameworks like MusicKit JS for Apple Music integration, CloudKit JS for iCloud-backed data storage, and more. Sign up for an Apple Developer account.
MapKit JS 6 makes token setup significantly simpler. You can now use a static token bound to your website’s domain, generated directly from the Apple Developer website — no private key management or self-signing required. For details, see Creating a Maps token.
Load the Framework
New in v6, the MapKit JS loader ships as an NPM package, so the framework integrates directly into modern build pipelines. If you are looking to build a quick prototype or load MapKit JS directly in HTML, you can also skip to [Loading the MapKit JS script in your browser] below.
Load with MapKit JS Loader
To get our Yosemite map running, the next step is to install the package:
npm install @apple/mapkit-loader
Now you can load the framework with the token you generated in the previous step:
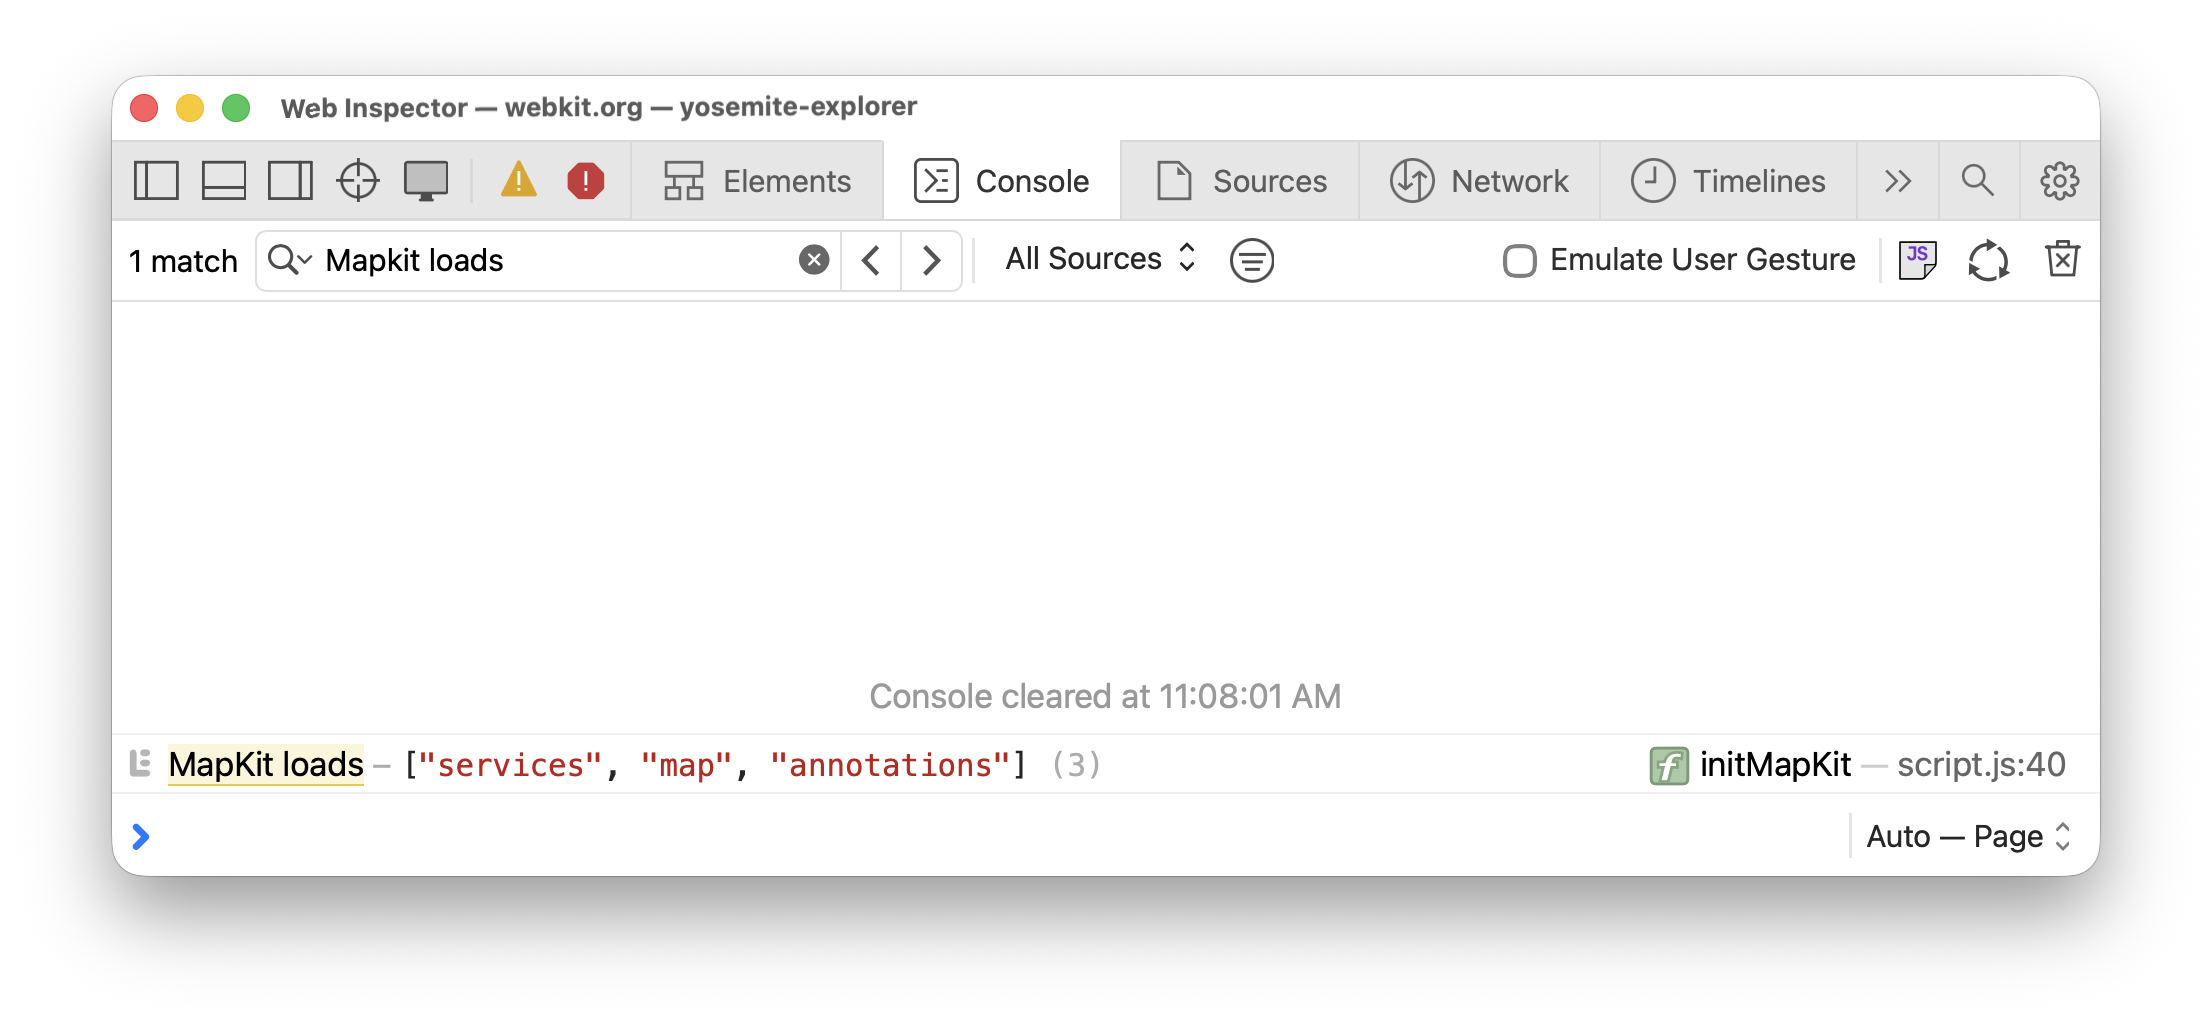
Let’s reload the page. The console.log() output should appear in Web Inspector:
MapKit JS partitions its features into libraries, so you load only what you need. Set the libraries array to the minimal set for the best performance. When you load MapKit JS through MapKit JS Loader, it automatically sources full TypeScript support through DefinitelyTyped into your project. Find a list of available libraries in developer documentation for MapKit JS.
Alternative: Load the MapKit JS script in HTML
For quick prototyping or web apps without a build pipeline, you can load and initialize MapKit JS with a <script> tag:
When the script loads, it invokes window.initMapKit — a callback you define — after which the mapkit namespace is available under window.
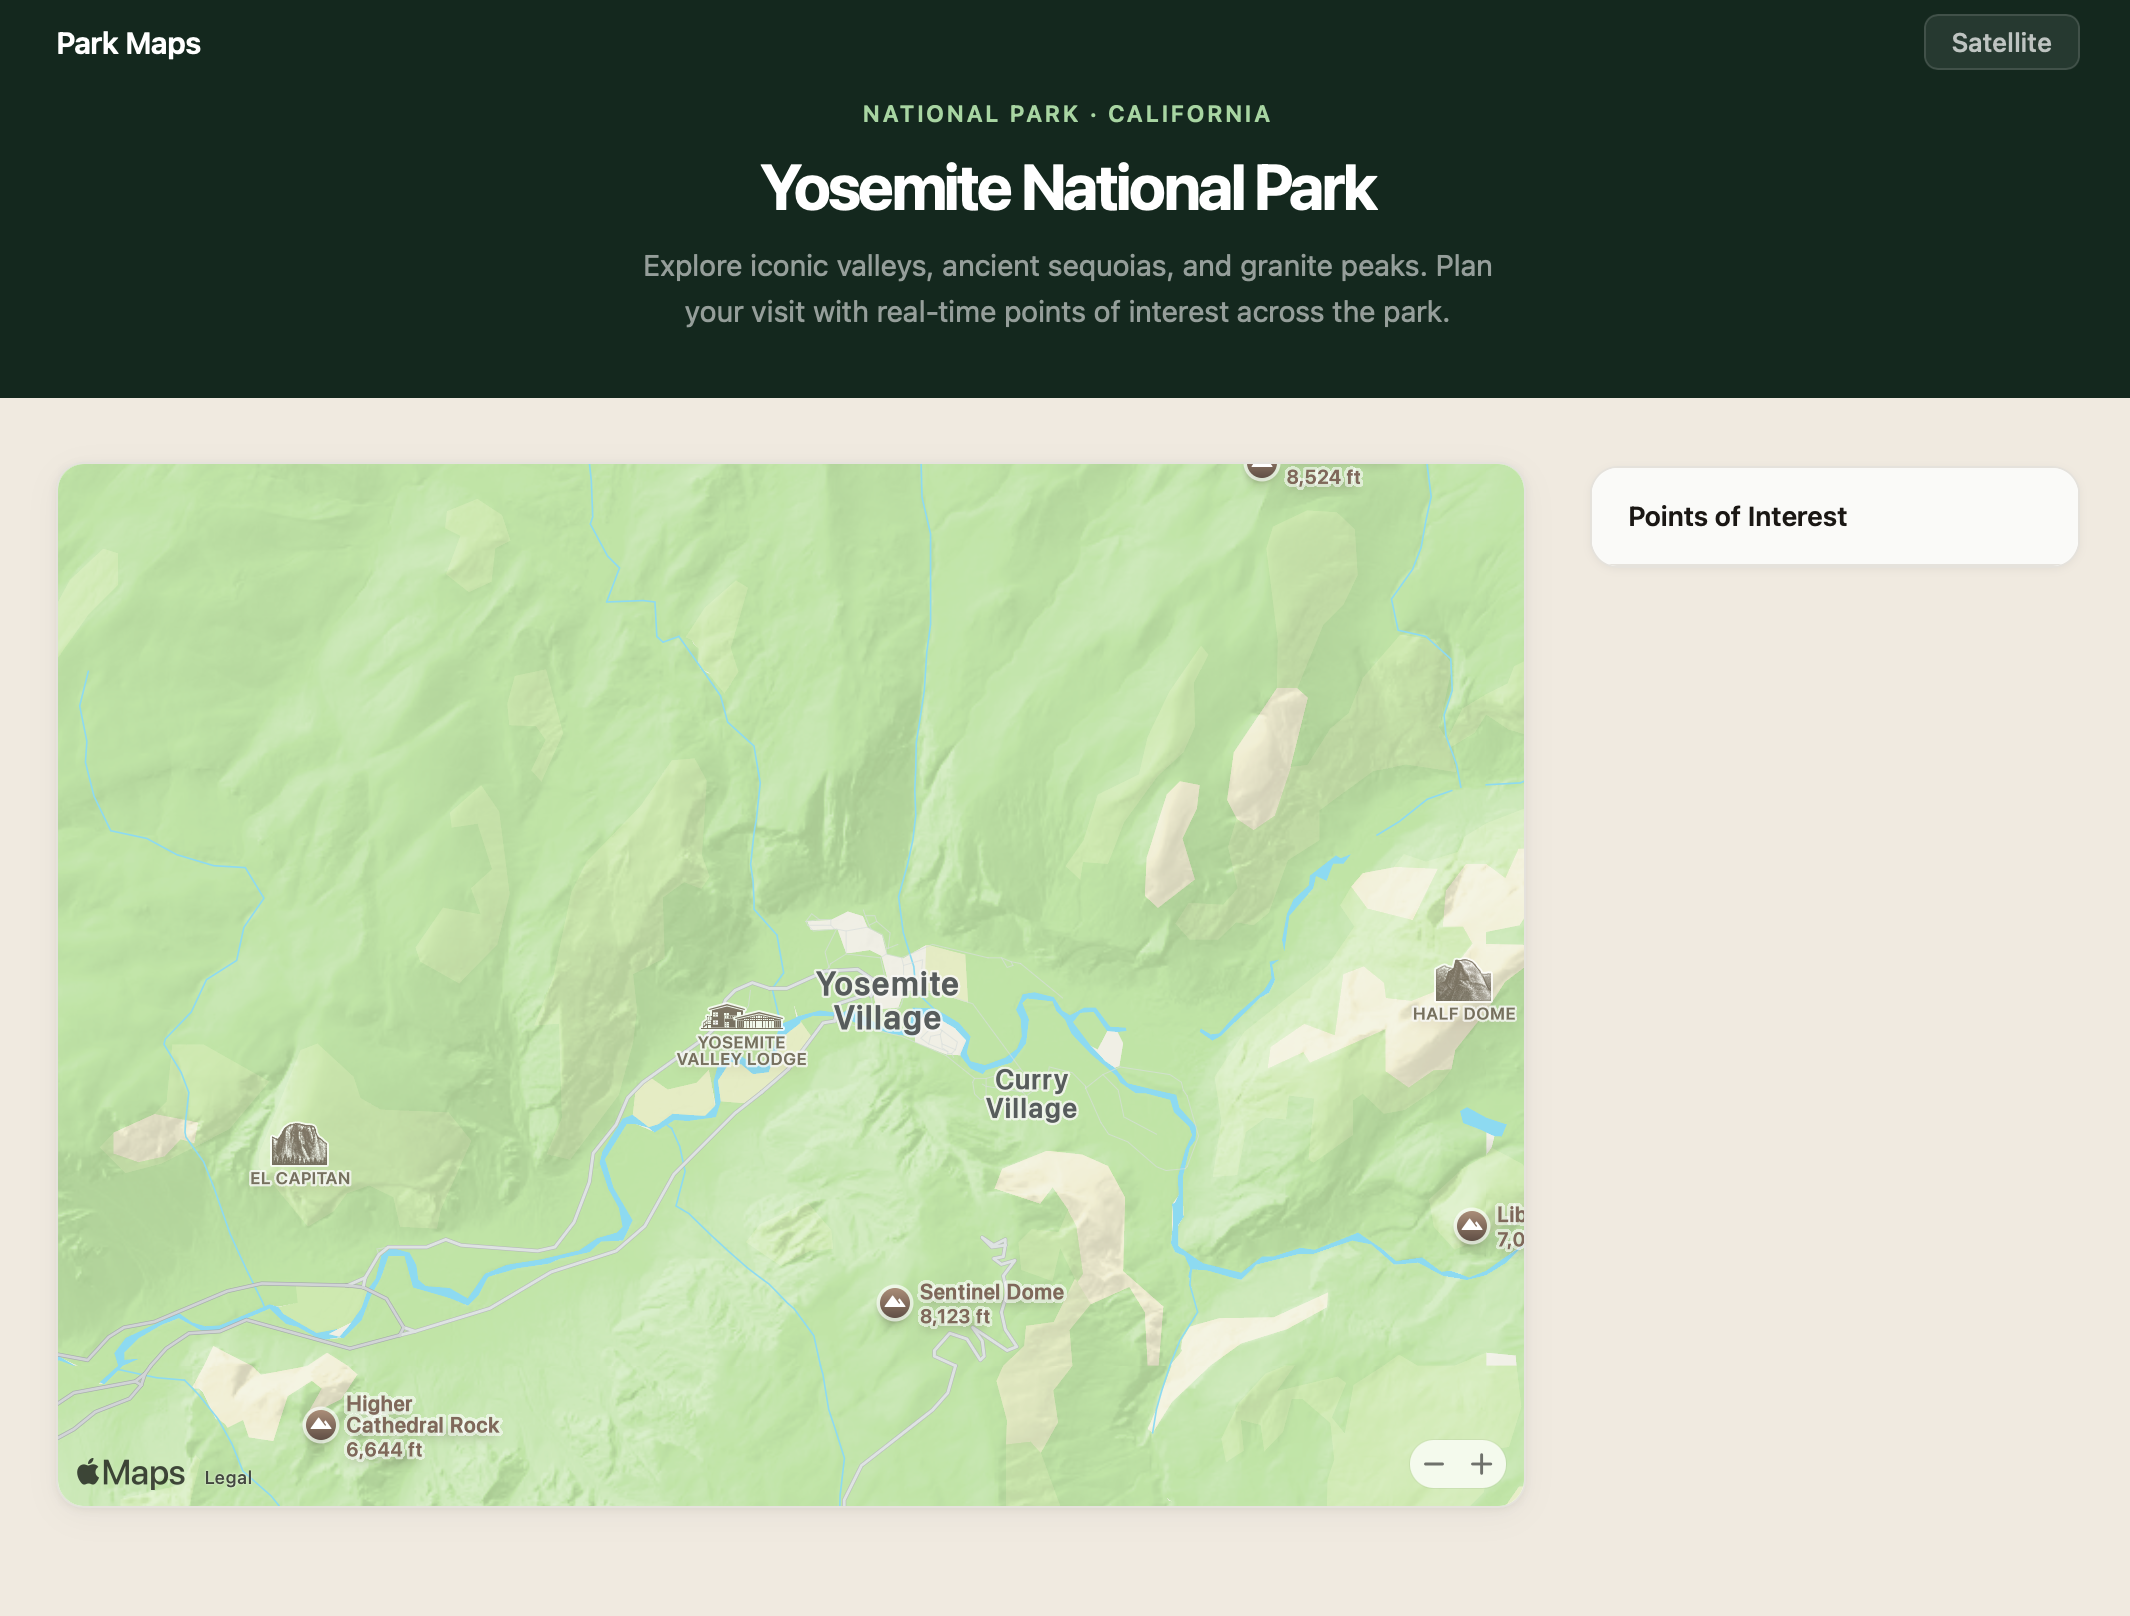
Create a Map
You create a map by passing the ID of a container element and a region. For our example, we center the map view on Yosemite Valley and set the camera high enough to cover the whole valley.
First, in HTML, define a sized container for the map view:
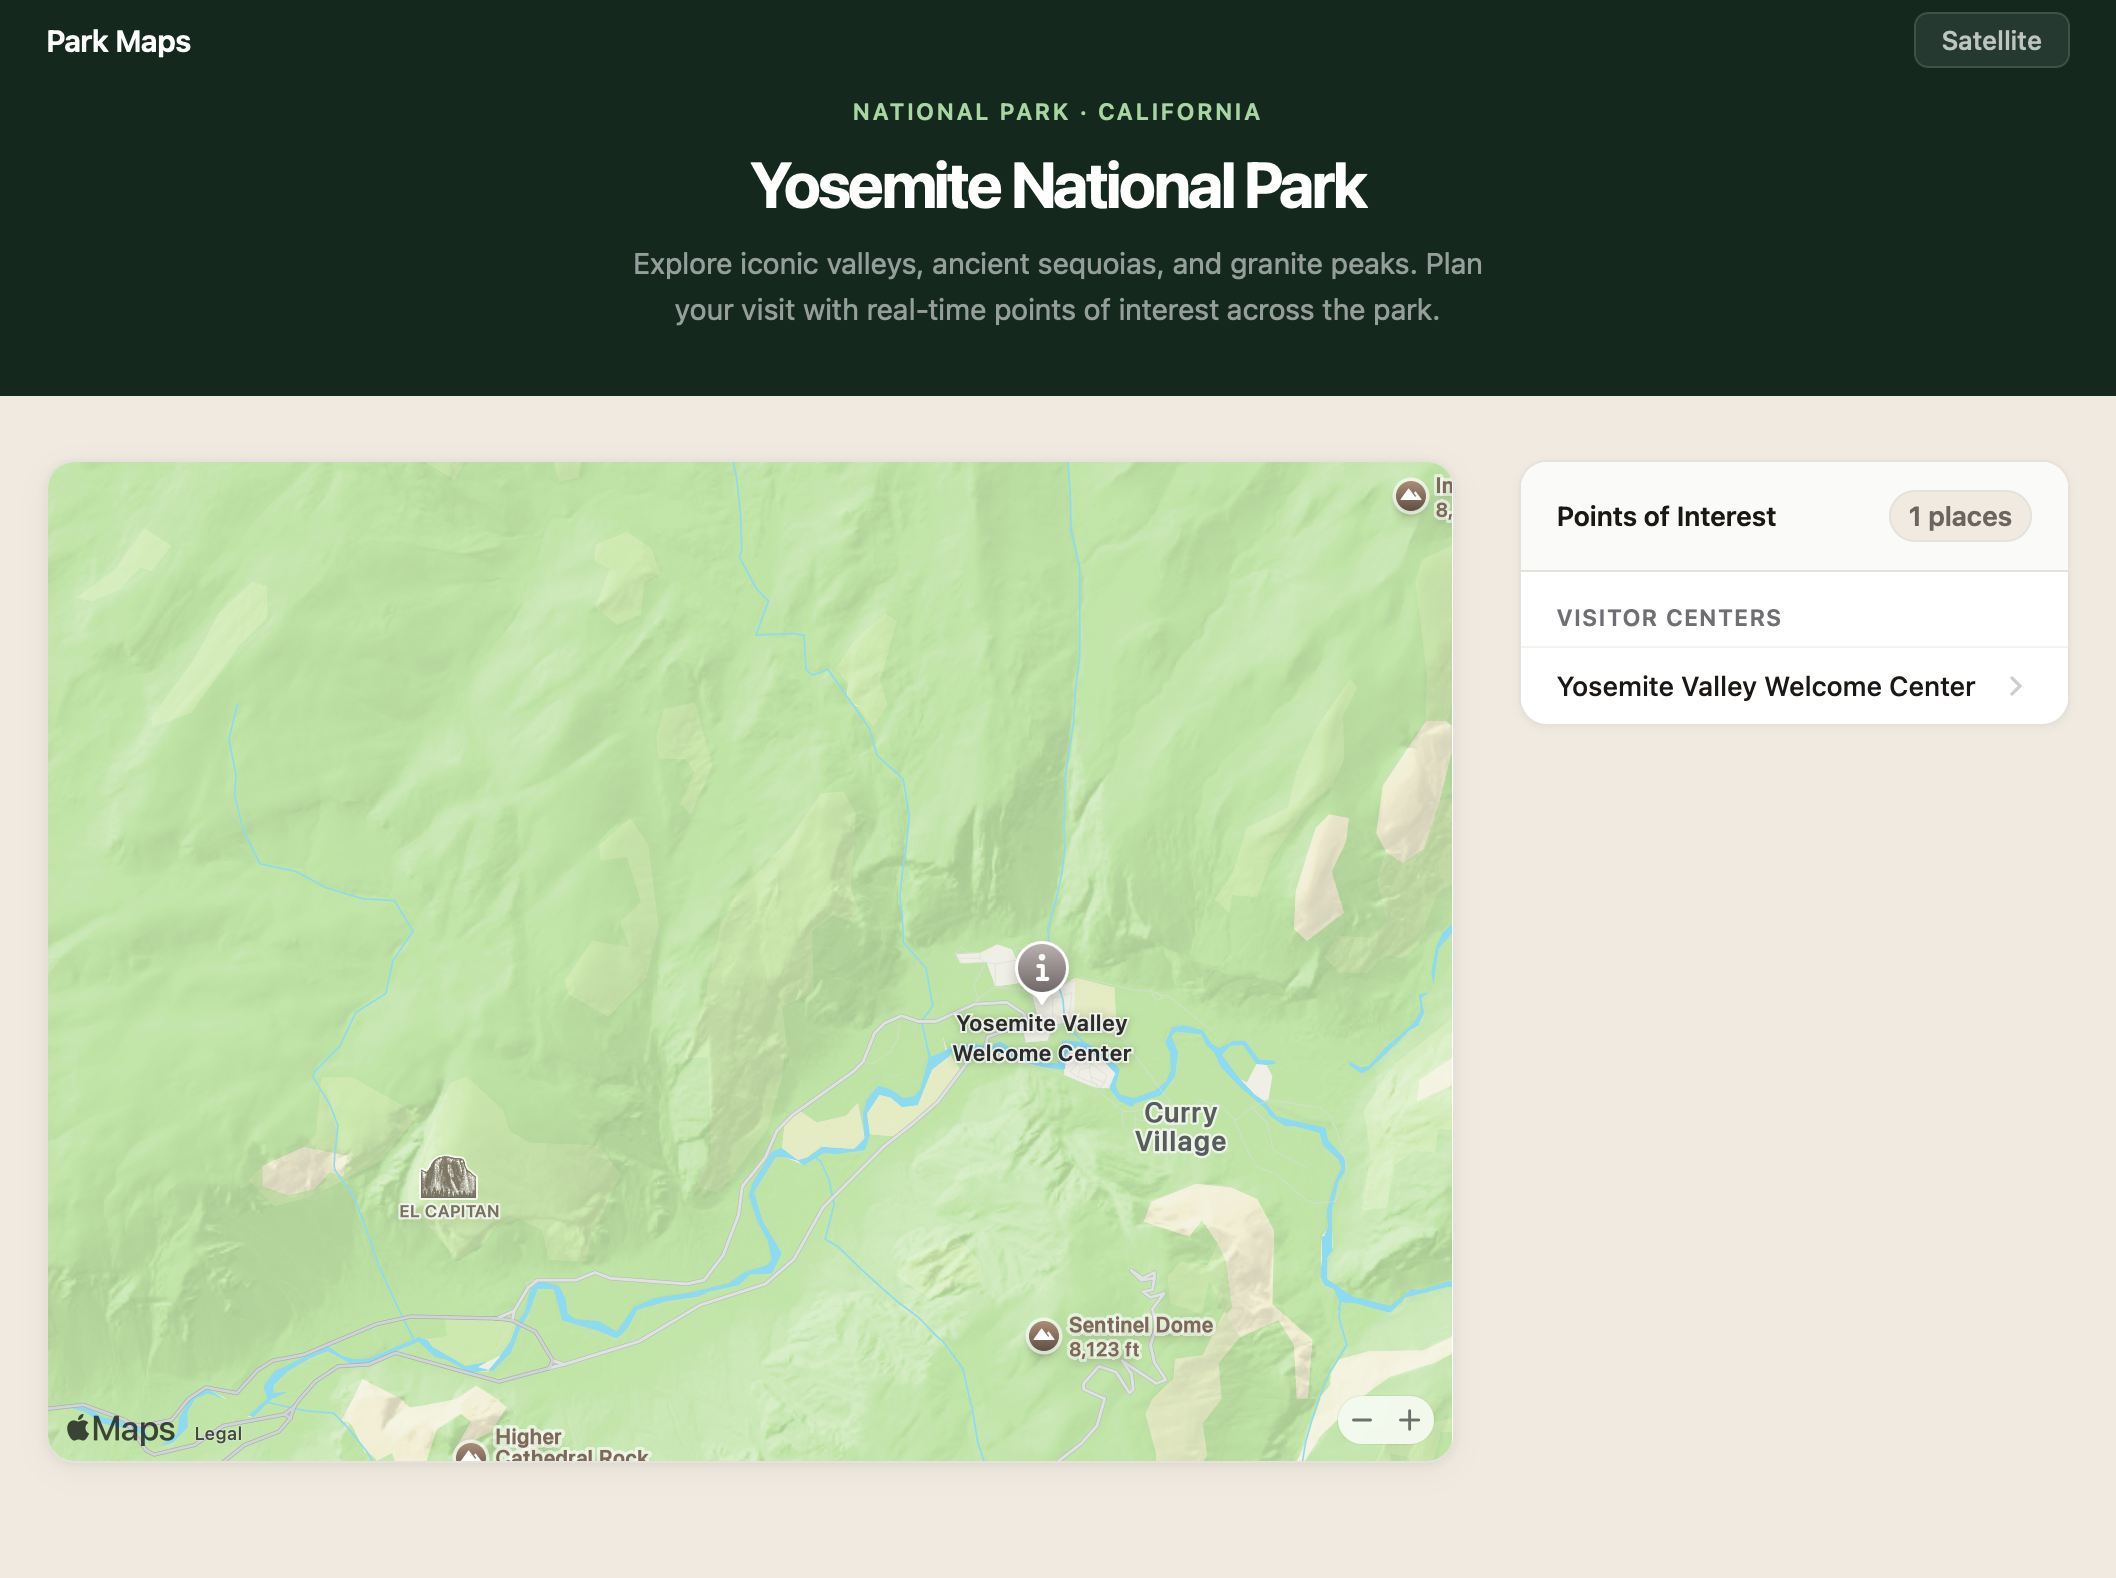
You can add custom annotations or overlays to the interactive map view. In this example, we’ll showcase places in Yosemite National Park with PlaceAnnotation — an annotation that automatically picks up the place’s title, coordinate, and iconography from Apple’s data.
Each place in Apple Maps is referenced by a Place ID, an opaque string that represents a point of interest rather than a specific coordinate or address. You can find Place IDs with the Place ID Lookup tool or the Search service. New in v6, PlaceLookup returns a promise, so you can pass a Place ID, await the result, and create the annotation in a single flow:
The code snippet above adds a PlaceAnnotation to the map and populates the same place on a list. The list draws the place name using the annotation.title property:
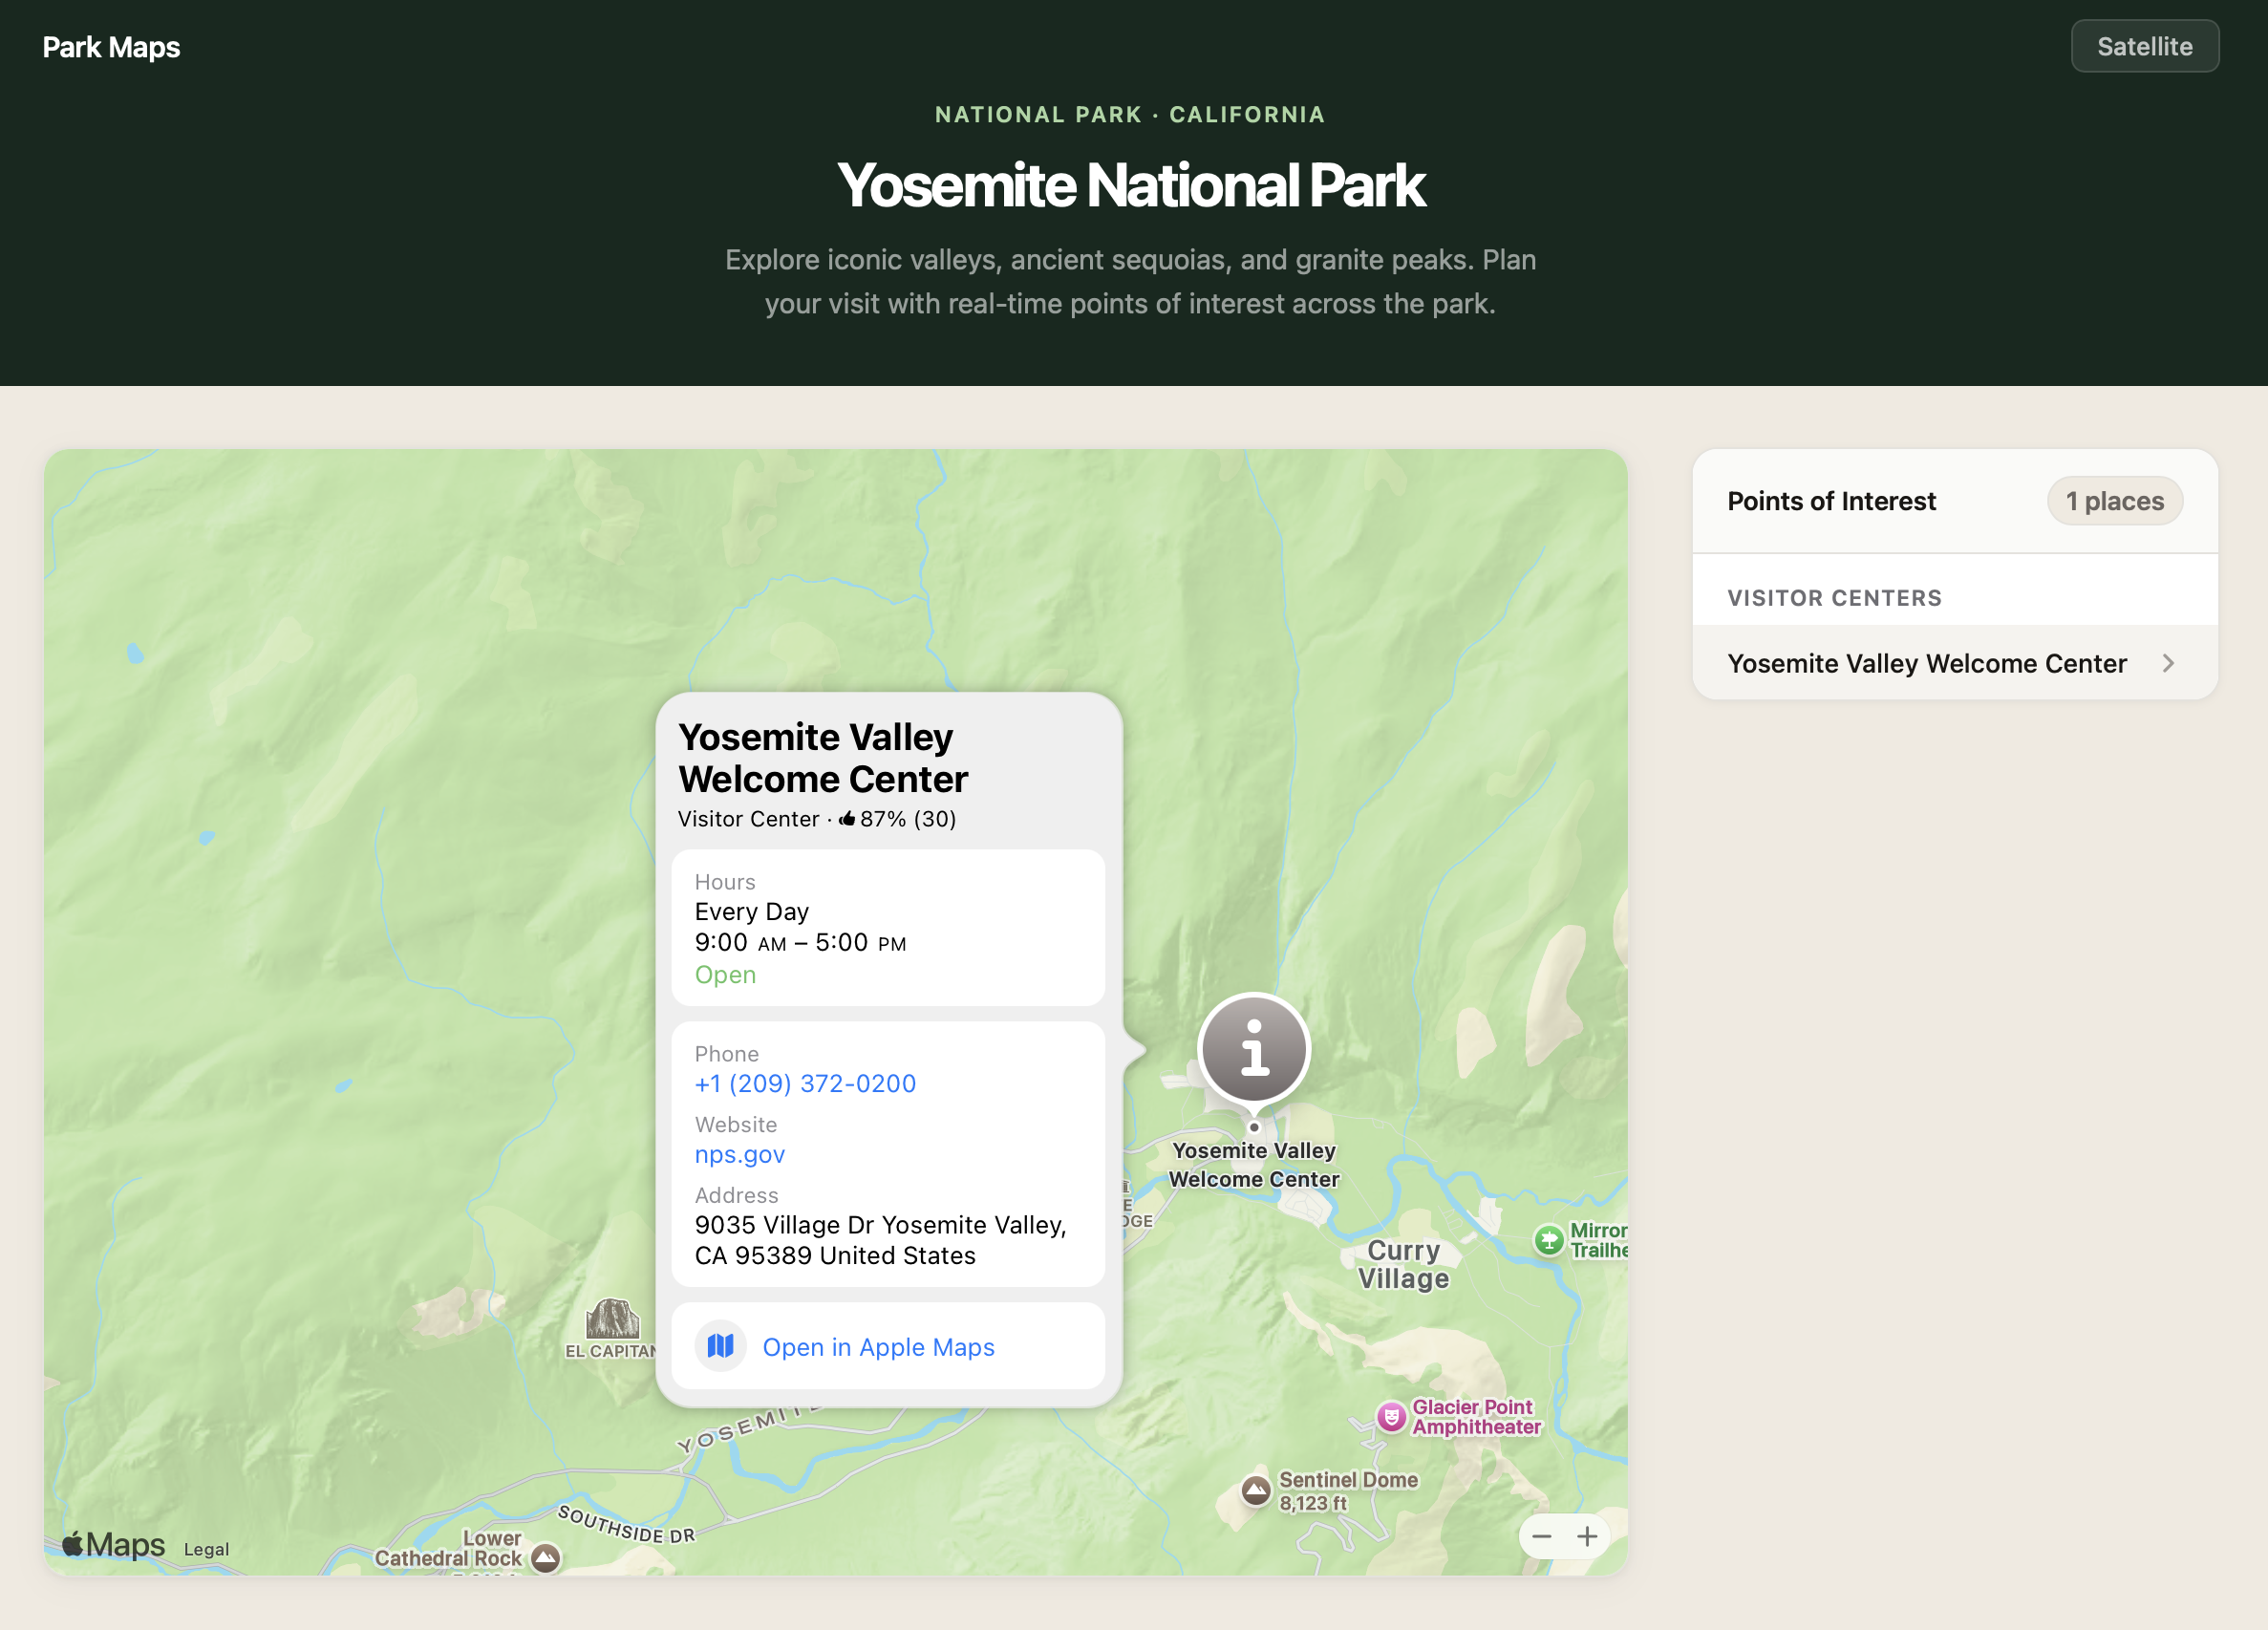
The snippet also sets a selectionAccessory option to a PlaceSelectionAccessory instance. When the user selects a marker, selection accessory displays detailed information of that place, like contact information or operating hours.
Repeat the place lookup to populate the app with all places.
Respond to Interactions
We want to present the user interface in a consistent state. New in v6, MapKit JS uses the standard browser EventTarget model, so handling map events works like handling any other DOM event. When the user selects an annotation on the map, you can update the corresponding list item:
Likewise, when the user selects a list item, select the corresponding annotation on the map. Since each list item holds a reference to the annotation instance, set its selected property to true:
This creates a two-way binding so the list and the map feel connected when either is interacted with. With that, we completed our app:
The same addEventListener pattern applies to annotation selections, map region changes, and every other MapKit JS interaction. See Handling map events to learn about all available event types.
Apple Maps, Built for the Web
In walking through the Yosemite Explorer example, you’ve seen several v6 changes working together. Installing MapKit JS as an npm package makes getting started more straightforward. Handling annotation selection with addEventListener puts the standard browser EventTarget model to work — one that v6 adopts consistently across the API. Using await for place lookups uses native promises throughout. And the authentication token you configured at the start is scoped to specific capabilities, giving you fine-grained control over access. Together, these changes make bringing the power of Apple Maps to your website a natural part of your development process.
Next Steps
Explore the MapKit JS documentation to dive deeper into the API. If you are using an earlier version of MapKit JS, check out the migration guide. Try the code samples in your own project, and share feedback through Feedback Assistant.
Safari Technology Preview Release 245 is now available for download for macOS Tahoe and macOS Sequoia. If you already have Safari Technology Preview installed, you can update it in System Settings under General → Software Update.
Fixed VoiceOver’s “Skip redundant labels” setting not being respected on certain web pages. (312967@main) (176297111)
CSS
New Features
Added support for the case-sensitive modifier s in CSS attribute selectors. (313234@main) (126331481)
Added support for the :host:has() compound selector in CSS. (313350@main) (139799278)
Resolved Issues
Fixed aspect-ratio not being respected on flex children when the flex container has position: absolute. (313213@main) (117807518)
Fixed aspect-ratio not working correctly on flex children that also have overflow set. (313170@main) (118926827)
Fixed image aspect-ratio not being preserved when width: 100% and height: 100% are set but no ancestor has a defined width. (313003@main) (162373271)
Fixed transferred min/max block-size constraints not being applied for intrinsic keyword widths on replaced elements. (313091@main) (173128588)
Fixed serialization of multi-word font family names that were always incorrectly quoted due to treating the full string as a single identifier. (313271@main) (175522811)
Fixed CSSStyleDeclaration.setProperty() failing to apply !important priority to an existing inline style property when the value was an integer of 255 or lower. (313159@main) (176099619)
Fixed an issue where elements using stretch sizing inside anonymous block wrappers resolved to their intrinsic size instead of stretching to fill the available space. (313359@main) (176398251)
Fixed -webkit-perspective not establishing a containing block for fixed-positioned descendants. (313020@main) (176729670)
Fixed nested multi-column layouts with three or more levels failing to paginate content across pages. (312973@main) (176741498)
Fixed :has() selector performance by using scope selectors to limit style invalidation traversal for class, attribute, and pseudo-class changes. (313009@main) (176771971)
Fixed non-replaced blocks with aspect-ratio and a percentage max-width collapsing to zero width during intrinsic sizing. (313074@main) (176873776)
Fixed percentage max-width on elements with aspect-ratio resolving against the wrong axis in perpendicular writing modes. (313078@main) (176879597)
Fixed z-index not applying to statically-positioned display: -webkit-box items to align with Firefox and Chrome behavior. (313081@main) (176886461)
Fixed flex containers using box-sizing: border-box providing the wrong cross size to stretched flex items. (313175@main) (176989934)
Fixed flex containers with aspect-ratio-derived height not providing a definite cross size to their flex items. (313256@main) (177085129)
Fixed SVG images with no intrinsic dimensions collapsing to zero height inside column flex containers. (313257@main) (177086497)
Editing
Resolved Issues
Fixed a regression where Vietnamese and Korean keyboard input methods incorrectly exited modeless composition mode, requiring a double spacebar press to complete each word. (313286@main) (176847897)
Fixed a recent regression that “Zhuyin – Traditional” input method stalling for multiple seconds when composing Chinese text. (313336@main) (177042301)
HTML
Resolved Issues
Fixed a severe performance regression causing dynamic insertion of <img> elements with a src attribute to be dramatically slower than other browsers. (313268@main) (166201075)
Fixed nested calls to requestClose() incorrectly firing multiple cancel events and causing a stack overflow. (313239@main) (174850509)
Fixed requestClose() incorrectly removing the open attribute when called on a disconnected dialog element. (313251@main) (174855725)
Fixed <a rel="ar"> elements wrapping <model> elements to correctly enter ARQL without extra steps and to display the AR badge. (313047@main) (176410897)
Fixed the HTML preload scanner not preloading resources referenced by legacy <image> tags. (312984@main) (176712749)
Images
Resolved Issues
Fixed rendering performance of HDR images that have gain-maps by using GPU-backed surfaces. (313339@main) (176605566)
JavaScript
New Features
Added support for static import defer semantics. (313139@main) (176568369)
Resolved Issues
Fixed the ArrayToPrimitive fast path incorrectly ignoring overrides of Object.prototype.valueOf. (313028@main) (175122250)
Fixed input position corruption in regular expression backward matching when rewinding over a surrogate pair. (313026@main) (175122467)
MathML
New Features
Added support for operator dictionary entries for multi-character operators to align with the MathML Core specification. (313083@main) (176543727)
Resolved Issues
Fixed the MathML operator dictionary to correct the stretchy property for several operators, resolving Web Platform Test failures. (312993@main) (170901728)
Fixed spacing values for prefix operators +, −, ±, ∓, ∇, and infix operator ⋉ in the MathML Core operator dictionary. (312999@main) (176652211)
Fixed the operator dictionary entry for the ∂ prefix operator to use the correct spacing values (3, 0) instead of (2, 1). (312997@main) (176693587)
Fixed nonce-hiding support for MathML elements to align with the HTML specification. (313075@main) (176875058)
Media
Resolved Issues
Fixed timeupdate events being fired during seeking before the seek operation completes. (313165@main) (176861767)
Fixed the ended event not always firing when the MediaSource duration is changed to match the current playback position. (313141@main) (176863546)
Fixed a MediaSource issue where the decode-key cleanup in coded frame processing was incorrectly removing non-orphaned samples. (313296@main) (176971800)
Fixed currentTime() returning a stale value after the playback rate was changed from zero to a non-zero value. (313249@main) (177046564)
Rendering
Resolved Issues
Fixed an issue where a child element with filter: blur() ignored border-radius overflow clipping from its parent. (312531@main) (175519148)
Fixed drop-shadow filters and transform: translate() incorrectly clipping nested elements after a regression. (313316@main) (175905543)
Fixed a repaint issue where table rows did not repaint their previous position after a preceding row changed size, causing content to appear at both the old and new locations. (313168@main) (176172404)
SVG
Resolved Issues
Fixed negative stroke-dashoffset values rendering with incorrect offsets when stroke-dasharray has an odd number of values. (313353@main) (103596361)
Fixed an issue where @prefers-color-scheme in an SVG image will sometimes not follow the system color appearance. (313021@main) (176413340)
Fixed getScreenCTM() returning an incorrect matrix when the document is scrolled under a CSS-transformed ancestor. (313111@main) (176814876)
Web API
Resolved Issues
Fixed missing custom element callbacks for the role attribute. (312976@main) (176713992)
Fixed incorrect URL parser invocation on the Notification object. (312988@main) (176762955)
Fixed requestAnimationFrame() not providing sub-millisecond timestamp precision in cross-origin isolated contexts. (313153@main) (176967366)
Added unique colors for style events such as “Style Invalidated” and “Style Recalculated” in the Timeline view to distinguish them from layout events. (312995@main) (176770197)
WebGPU
Resolved Issues
Fixed a WGSL shader validation failure in binary arithmetic expressions. (313135@main) (176473479)
WebRTC
Resolved Issues
Fixed outgoing video feeds freezing when the Safari window is obscured by another window while a virtual background is active. (312990@main) (170720729)
Fixed screen sharing via getDisplayMedia() starting at extremely low quality and taking up to 30 seconds to become legible for remote participants. (313072@main) (175425085)
Update on what happened in WebKit in the week from June 1 to June 8.
Another great week, this time we have a performance improvement implemented
in the Skia-based compositor, an excellent writeup about how to investigate
and isolate memory leaks in WPE WebKit, a couple of multimedia fixes, and a
variety of improvements and fixes across WebKit ports.
Implement node iterator and live range pre-remove steps for in-progress moveBefore() implementation.
Fix an early return in CloseWatcher close to align with the spec.
The Web Inspector now shows DOM nodes associated with layout and rendering events in a separate column of layout timeline next to initiator, sizing, and timing information. Hovering over rows in the details table highlights the associated node, and clicking it reveals the node in the "Elements" tab. This makes it easier to match events with specific nodes and helps debugging changes to a web page.
Fix popover light dismiss to account for disabled command buttons.
Multimedia 🎥
GStreamer-based multimedia support for WebKit, including (but not limited to) playback, capture, WebAudio, WebCodecs, and WebRTC.
FixmediaTime provided with requestVideoFrameCallback in case of captureCanvas as source.
Batched painting support was implemented in the Skia-based compositor, improving the performance in several cases.
Community & Events 🤝
Pawel Lampe published a blog post where he's presenting and discussing a guide on structured approach to narrowing down and debugging memory leaks within WPE WebKit.
Welcome to WWDC26. This year, the WebKit team is here with six sessions covering new CSS layouts, customizable form controls, 3D models, immersive spatial experiences, and browser extensions. Regardless of what you’re building for the web, we hope there’s something in here that might make doing your work a little easier, and maybe a little more exciting.
Watch them all on the Apple Developer site, or read on to find the sessions you’re interested in.
For an overview of what we’ve been working to bring you this past year, start here. We cover the full range of what’s coming to Safari 27 with a particular focus on quality. We’ve shipped over 1000 fixes and improvements across the board, and we hope that work solves some of your problems and makes it easier for you to build for the web. Quality leads the agenda, but we still made room for some great features as well. This session gives a sneak peek at the five features brought to you in Safari 27.
Grid lanes finally brings the dream of a CSS-only masonry layout to the web, allowing you to create the famous Pinterest-style layout with no additional JavaScript required. It works in both the vertical “waterfall” direction and the horizontal “brick” direction, and it brings the full power of CSS Grid track sizing with it.
Brandon shows you the few lines of code it takes to implement this layout and also teaches you about some of its helpful features, like flow-tolerance, which gives you control over how far items can drift from source order to fill in the layout — an important consideration for accessibility.
To play with Grid Lanes yourself, check out our interactive demo on our Field Guide at gridlanes.webkit.org and experiment with the layout options. When you’re ready, you can copy the code you write and bring it into your own projects.
If you’ve built forms for the web, you’ve probably had your fair share of wrestling form controls. Customizable select is here to give you a better alternative, using the power of just HTML and CSS.
Add appearance: base-select to any <select> element and it immediately starts inheriting your design system — fonts, colors, and more. From there, you have full CSS control over every part of the element: the picker popup via ::picker(select), the disclosure icon via ::picker-icon, the selected option’s checkmark via ::checkmark. You can even add rich HTML content inside your <option> elements — descriptions, images, anything you want — while keeping all the accessibility and robustness of a native form control.
This session is Tim’s guide to what Customizable Select now makes possible: a form control that’s truly in your control. If you’ve ever built a custom dropdown from scratch to get the styling you needed, this session is for you.
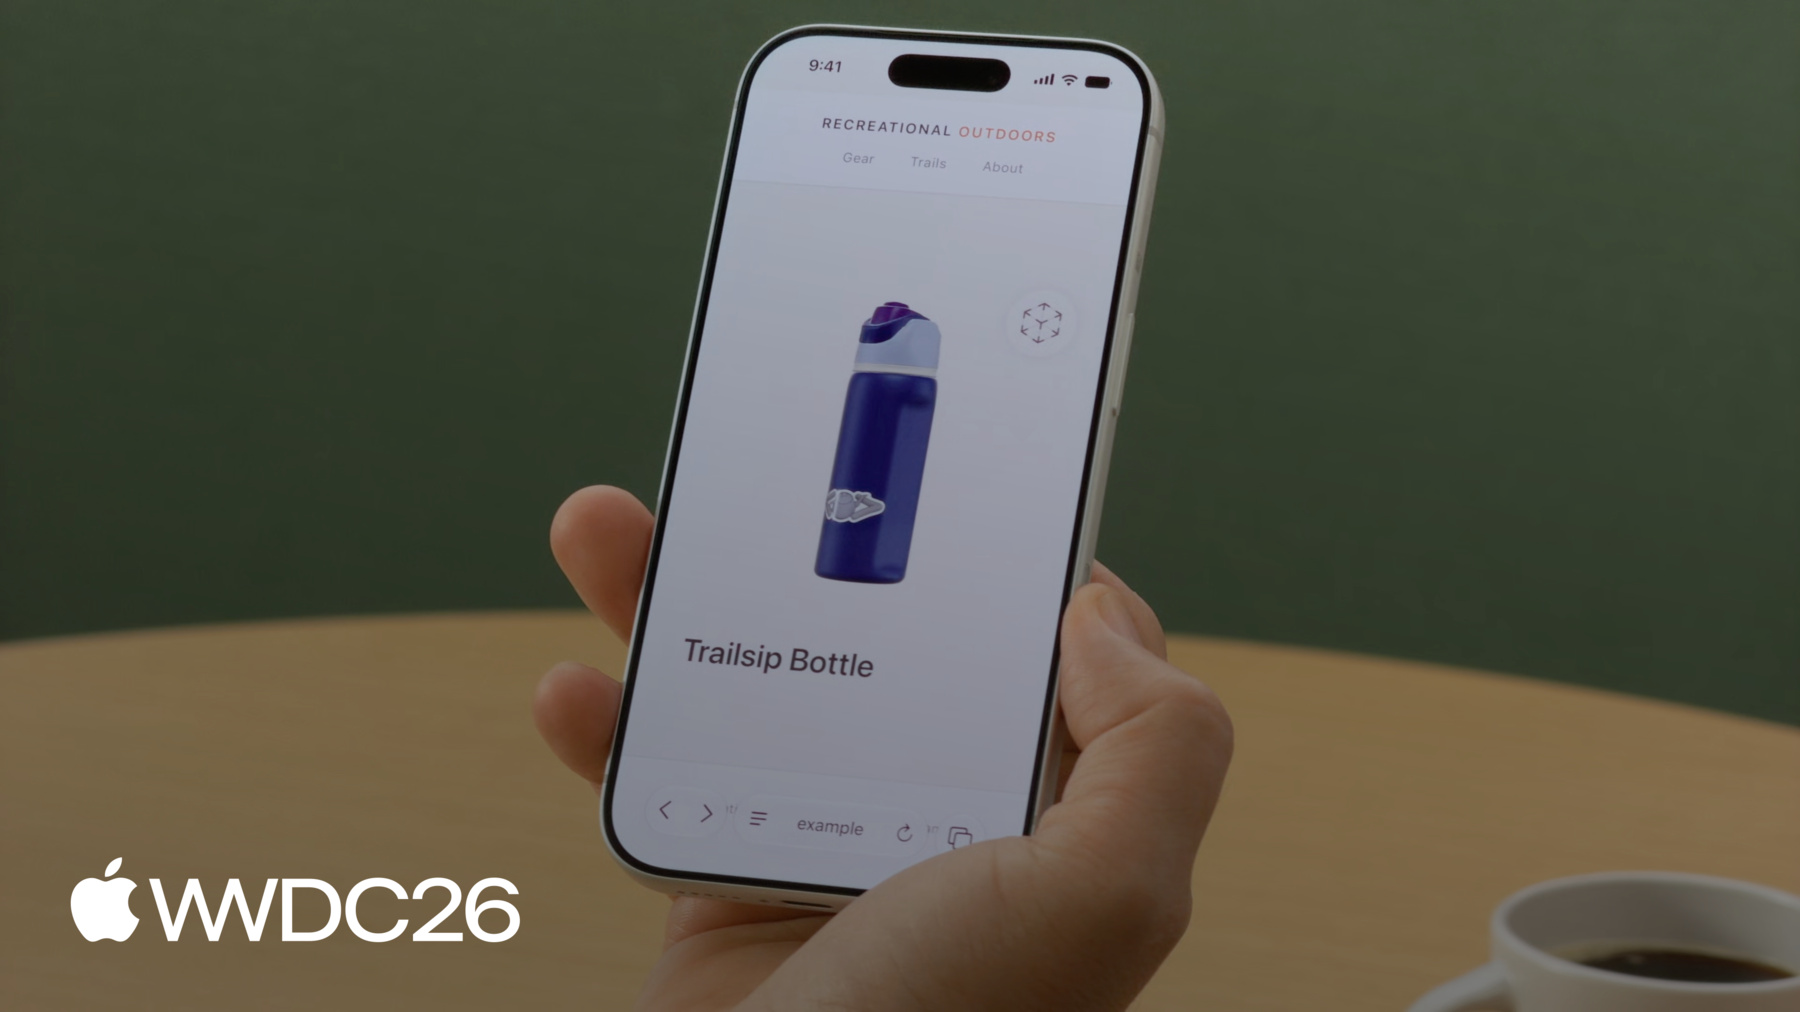
The <model> element comes to iOS, iPadOS, and macOS in Safari 27. Embedding interactive 3D models in a webpage now works like embedding any other media: use a <source> element to provide files in multiple formats, set environmentmap for custom lighting, use stagemode="orbit" to let users rotate the model, and reach for the JavaScript API for more programmatic control.
If you’re new to the world of 3D models, Aleksei guides you through the process, starting from the first question: where do you even get 3D models? Then he moves into how to optimize them for the web, how to write the markup, and how to use the JavaScript API for animation playback, programmatic rotation, and more.
Whether you’re building a product preview for your online store, an educational tool, or just something eye catching to grab your users attention, this session gives you a practical on-ramp.
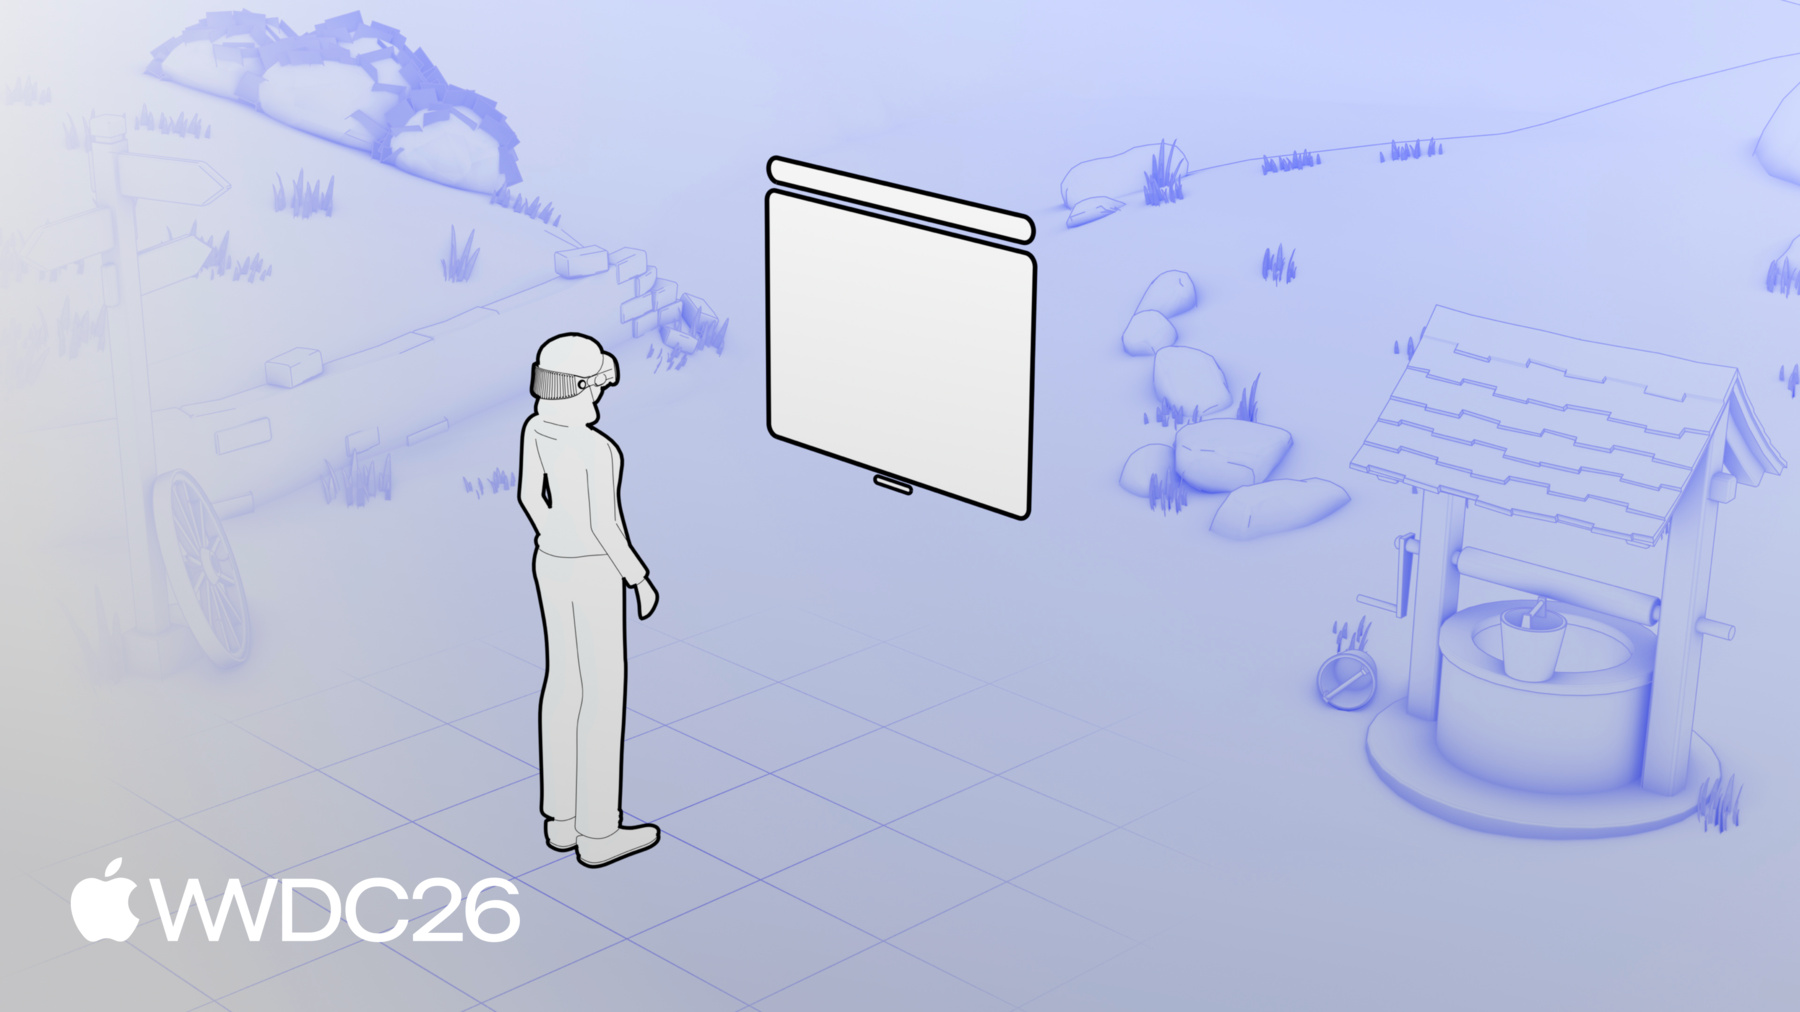
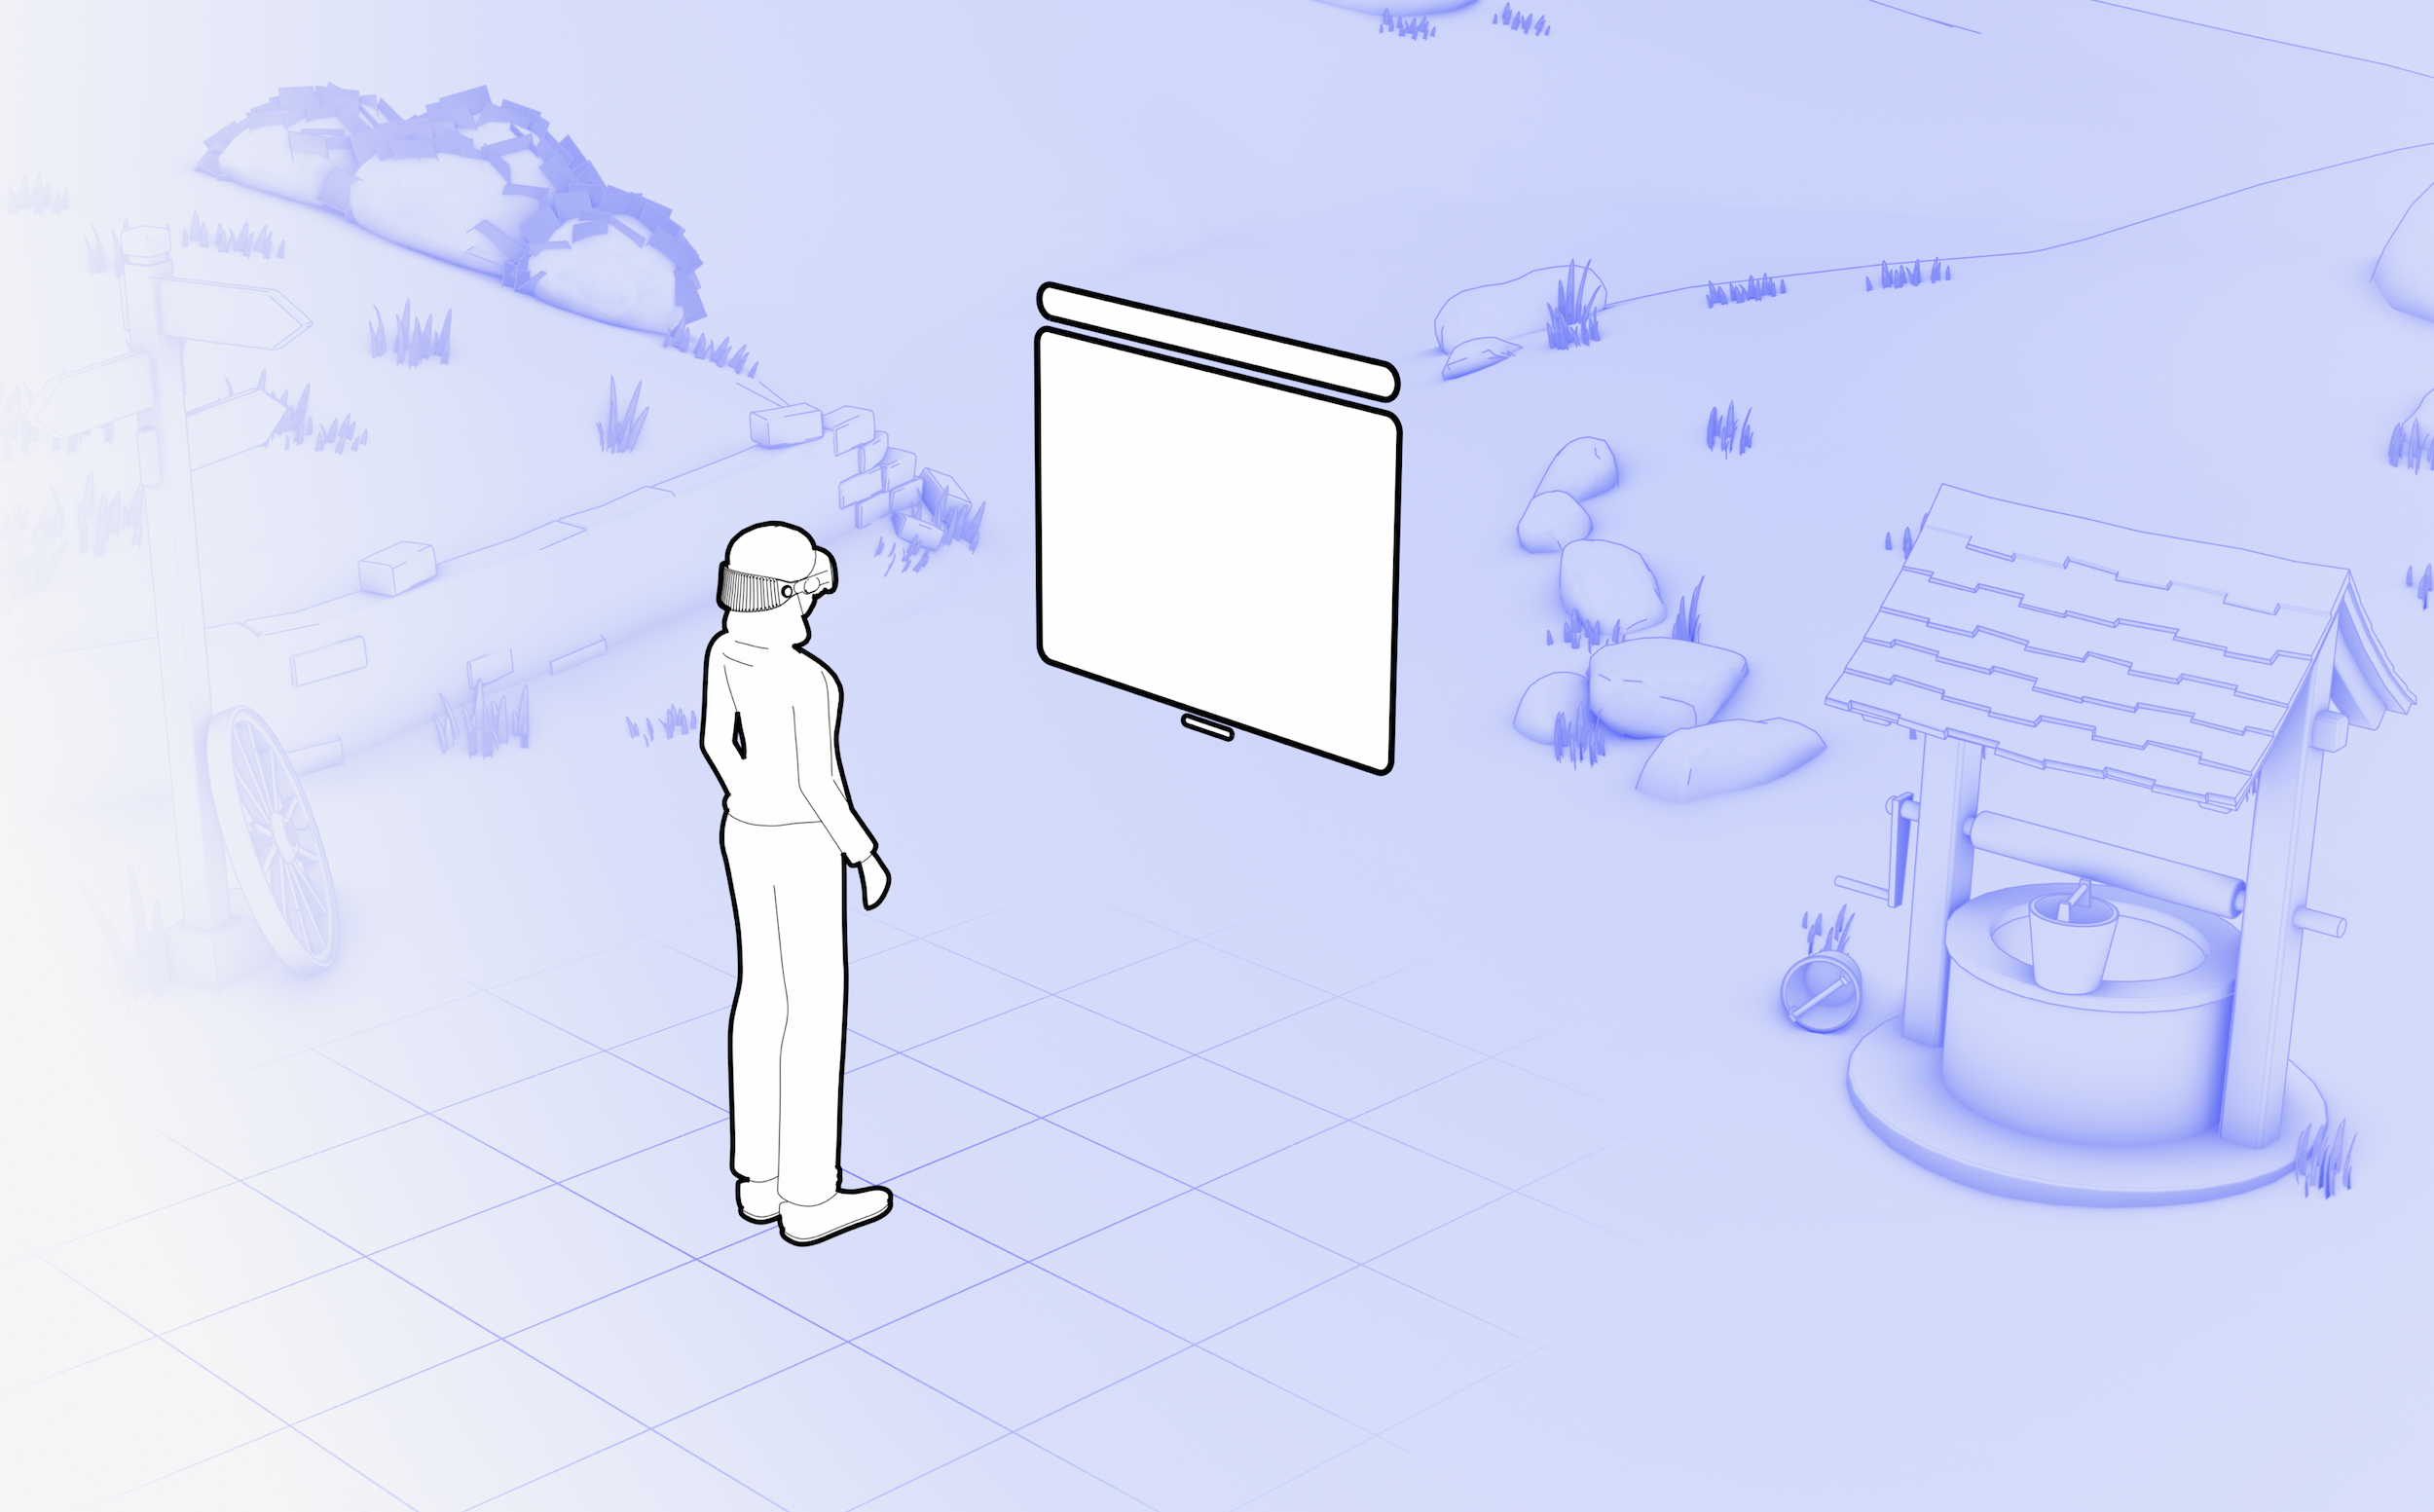
In visionOS 27, <model> goes further still with immersive website environments. A user can tap to leave the browser window behind and be surrounded by the model you provide — a full spatial experience launched directly from a webpage.
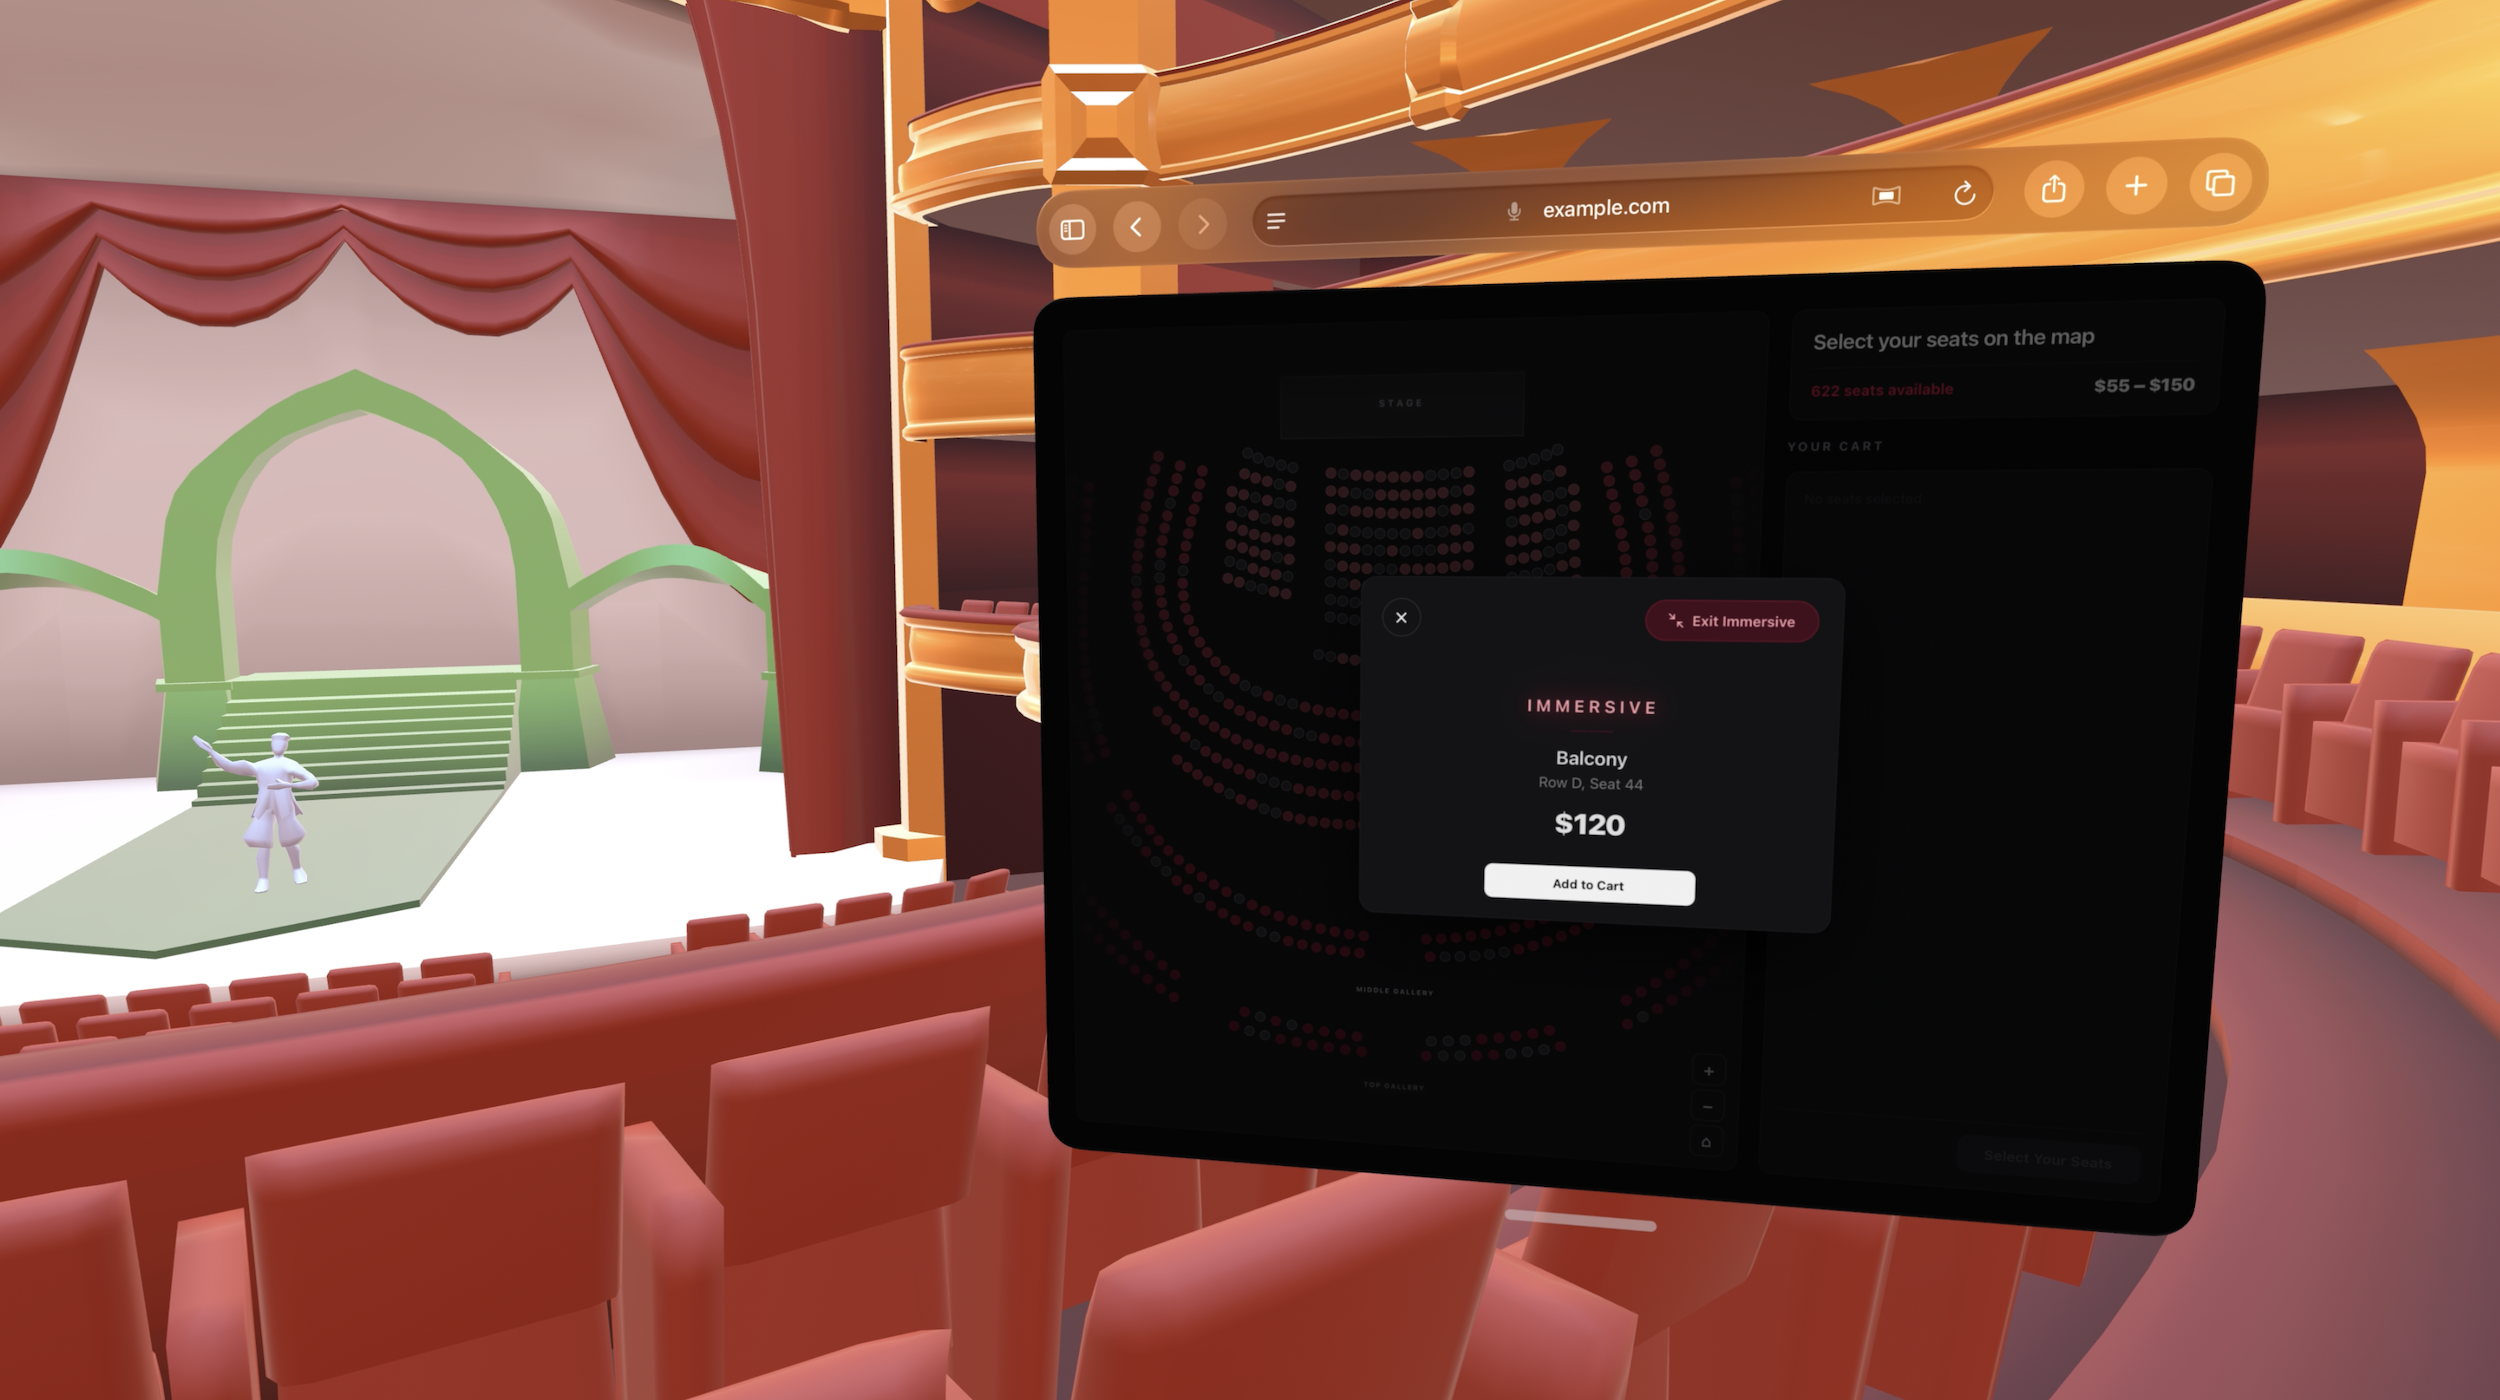
The Immersive API — which is very similar to the Fullscreen API — gives you control over how the environment appears and how users interact with it. Jean built an interactive theater-seating experience to show how this works in practice: a user browses seats on a webpage, then steps into the theater itself to see the view from their seat before they buy.
This session covers what’s possible, how the API works, and the decisions that go into designing an experience that feels right in visionOS.
And for Web Extensions, the Safari web extension packager makes it easier than ever to distribute your extension. Publishing a Safari extension no longer requires Xcode, or even a Mac. Now, you can package and submit your extension using App Store Connect from any web browser, on any operating system. One codebase, every browser.
But this session is about more than just packaging — Kiara breaks down how to build a web extension step by step, building a web extension from the ground up. If you’ve been holding off on publishing your extension for Safari, or if you’re building your first extension and want to support all browsers from the start, this is the session to watch.
We cover a wide range of web topics in this year’s session, including layouts, 3D objects, and web extensions. Whether it’s a feature or a fix, we hope you’ll find something here that’s applicable and helpful to the work that you do. Enjoy WWDC26!
Feedback
We love hearing from you. To share your thoughts, find our web evangelists online: Jen Simmons on Bluesky / Mastodon, Saron Yitbarek on BlueSky, and Jon Davis on Bluesky / Mastodon. You can follow WebKit on LinkedIn. If you run into any issues, we welcome your feedback on Safari UI (learn more about filing Feedback), or your WebKit bug report about web technologies or Web Inspector. If you run into a website that isn’t working as expected, please file a report at webcompat.com. Filing issues really does make a difference.
Safari 27 beta is here. Don’t miss our WWDC26 sessions on web technology, including What’s new in WebKit for Safari 27, to go deeper on our work in this release. Now, let’s dig into this beta, packed with 58 new features, 525 fixes and 4 deprecations that will hopefully make your work as a web developer a little easier.
Here’s a sneak peek of the highlights:
After years of anticipation, you can now use customizable <select> to style your form elements to match the rest of your site or app without rebuilding it in JavaScript or sacrificing accessibility.
Scroll anchoring prevents those visual jumps when content loads above the viewport.
WebAssembly JavaScript Promise Integration (JSPI) lets Wasm code participate in the async world of JavaScript.
Transform-aware anchor positioning closes out a major gap in the anchor positioning story.
The :heading pseudo-class, the revert-rule keyword, and the stretch keyword for box sizing all land in CSS.
Subpixel inline layout makes text rendering more precise.
And that’s just the start.
If you look through the lists of features and fixes in Safari 27, you’ll notice that, although there are 58 brand-new features and 525 fixes — the largest pile of fixes in any Safari release in recent memory — most of what is released is not about new things.
Most of this work has been about existing features behaving more correctly, handling more edge cases, and fitting together with other features the way you’d expect. We committed our time to increasing quality — that’s the story of this release and the year that led to it.
A lot of this work was also about aligning to web standards. When we found a spec that was unclear or incomplete, we helped update it, and then updated WebKit to match.
For example, Safari 27 contains 30 SVG fixes, including updates based on recent decisions in SVG 2 where we revived the Working Group. SVG is used on 67% of webpages, making this work very impactful. Anchor positioning continues to get refined as the CSS specification settles. And in more subtle places throughout the release — URL parsing details, event listener options, timezone identifier handling, innerText edge cases — features that look unchanged on the surface now behave the same way in Safari as they do in Chrome, Firefox, and Edge.
We also spent time making sure features still work across different contexts. A :has() selector invalidating properly when siblings change. An aspect-ratio resolving correctly against a percentage height. box-shadow rendering correctly on table-row elements. background-clip: text working on table header elements. Bugs that appear when combining features are among the hardest to find and the most frustrating, but we’ve made significant progress in hunting them down.
If something has been bothering you, test it in Safari 27 beta. You might be pleasantly surprised. And if it hasn’t been fixed yet, file a bug report, or add a comment to an existing issue with a concrete scenario, a link to a real site, or a reduced test case. The more concrete the problem, the more helpful it is.
This work goes beyond the Safari browser. When your customers open their news app, their banking app, their shopping app, there’s a good chance the interface they interact with is powered by the HTML, CSS, and JavaScript that’s rendered by WebKit and JavaScriptCore — the same engines inside Safari. Every fix in this release isn’t just for the browser — it benefits everything the web platform touches.
Let’s dive in.
Customizable Select
Safari 27 beta adds support for customizable <select> , which transforms the <select> element. You can now build a fully custom form element that matches the look and feel of your website or web app, without reaching for a JavaScript library or sacrificing the accessibility, reliability, and native platform integration of a real HTML form control.
Use the new appearance: base-select to clear the native styling and start with a clean palette. Then insert any additional CSS you want to create your custom design. Customizable <select> comes with new pseudo-elements for more granular control, like ::picker-icon to target the disclosure indicator and ::checkmark to target the checkmark that appears next to the selected <option>. Both can be fully customized.
Use the new <selectedcontent> element inside the button to display the currently selected option’s content and style <selectedcontent> directly to get it to look exactly how you want in the closed state.
And because you’re still working with a real <select>, everything that comes with a native form control still works: keyboard navigation, screen reader support, form submission, validation, change events. You get the styling freedom of a custom widget with the power of a native HTML element.
Customizable <select> is a multi-vendor effort. The same syntax is coming to other browsers. Use progressive enhancement and style your <select> with appearance: base-select for a great experience in browsers that support it, and let browsers that don’t fall back to their built-in rendering.
Learn more in the WWDC26 session Rediscover the HTML Select Element, where Tim walks through the full API and how to build layouts inside options with Grid and Flexbox.
Additional bug fixes:
Fixed an issue where <select multiple> did not always fire onchange when the mouse button was released far outside the element. (173882861)
Fixed an issue where <select> control rendering was broken in vertical writing mode. (174068353)
Fixed a performance issue where parsing <select> elements with thousands of <option> children via innerHTML caused O(n²) overhead due to repeated list recalculation. (174244946)
Fixed <option> elements to correctly implement the HTML specification’s dirtiness concept for tracking user-modified selected state. (175306111)
Fixed the select picker appearing at an incorrect position when the <select> element is anchor positioned. (175454476)
Fixed the default display value for <optgroup> and <option> elements to block, matching the behavior of other browsers. (175473184)
Fixed <option> and <optgroup> elements to match the :disabled pseudo-class when inside a disabled <select>. (176559708)
Animations
Safari 27 beta adds the animation property to the AnimationEvent and TransitionEvent interfaces, letting event handlers directly access the Animation object associated with the event.
Additional bug fixes:
Fixed an issue where animation-fill-mode did not correctly apply viewport-based units after the viewport was resized. (80075191)
Fixed an issue where !important declarations did not override CSS animation values when CSS transitions were also running on the same property. (174367827)
Fixed an issue where identity matrix decomposition generated invalid quaternions, resulting in incorrect transform animations. (174813328)
CSS
Transform-aware anchor positioning
Safari 27 beta adds support for transform-aware anchor positioning. Now, when an anchor element has a CSS transform applied — scale, rotate, translate, or any combination — elements positioned relative to that anchor follow its transformed position instead of its pre-transform layout position. This works for transforms applied via the transform property as well as through the individual translate, rotate, and scale properties.
This closes a long-standing gap in the anchor positioning story. If you use anchor positioning to attach a tooltip, popover, or annotation to a transformed element, it now tracks correctly, even with animated transforms.
:heading pseudo-class
Safari 27 beta adds support for the :heading pseudo-class, which matches any heading element — <h1> through <h6>.
Instead of writing h1, h2, h3, h4, h5, h6 in your selector list, you can just write :heading. And :heading can also be combined with functional selectors to target headings at specific levels:
revert-rule keyword
The revert-rule keyword is now supported in Safari 27 beta. Like revert and revert-layer, revert-rule rolls back the cascade — but specifically to the state as if the current style rule had not been present.
It gives you a more precise tool for working with overrides, especially in component libraries and design systems where you want to selectively undo declarations within a rule without losing the rest.
stretch keyword for box sizing
Safari 27 beta adds support for the stretch keyword in box sizing properties like width, height, min-width, and so on. stretch tells an element to fill the available space in the relevant axis, accounting for margins.
.card {
  width: stretch;
}
Previously, the common way to achieve this was width: 100% — which doesn’t account for margins and can cause overflow when margins are applied. The stretch keyword does the right thing. If you’ve been using -webkit-fill-available as a workaround for the same behavior, now is a good time to switch.
Dutch IJ digraph in text-transform: capitalize and ::first-letter
The Dutch IJ digraph is now available in Safari 27 beta. When the content language is Dutch (lang="nl"), text-transform: capitalize and ::first-letter now correctly titlecase “ij” to “IJ” at the start of words.
A small but genuine improvement for anyone writing Dutch text on the web.
position-anchor: normal and none
Safari 27 beta adds support for position-anchor: normal and position-anchor: none. Before, position-anchor defaults to auto, which makes every element use the implicit anchor element as its default anchor, if one exists. This has a side effect of changing an element’s positioning behavior, whether it uses anchor positioning or not. This may result in compatibility problems.
To fix this, the CSS Working Group has added two values to position-anchor to allow opting out of the new behavior:
none: an element does not have a default anchor, and its positioning behavior is unchanged.
normal: auto if an element uses position-area, otherwise none.
position-anchor: normal is the new default value, replacing auto. This means elements will only have a default anchor and get anchor positioning behavior if it uses position-area, otherwise its behavior remains unchanged.
anchor-valid and anchor-visible
Safari 27 beta adds support for anchor-valid and anchor-visible . Originally, position-visibility: anchors-valid hides an element if any of its required anchor references can’t be resolved. However, it was not clear what constitutes “required anchor references”. The CSS Working Group has since then changed its behavior to only look at the default anchor box. To match the new behavior, some keywords also got renamed to drop the plurality:
anchors-valid is renamed to anchor-valid
anchors-visible is renamed to anchor-visible
Safari 27 beta aligns with the new behavior but also still supports the old keywords for compatibility.
Style containment for quotes
Safari 27 beta adds support for contain: style applying to CSS quotes. This allows you to scope effects of quotes to a certain subtree.
insert keyword for text-autospace
Safari 18.4 added support for text-autospace to control spacing between Chinese/Japanese/Korean (CJK) and non-CJK characters. Safari 27 beta now adds the insert keyword, making the following syntaxes equivalent:
Fixed an issue where -webkit-text-fill-color incorrectly overrode text-decoration-color. (47010945)
Fixed shape-outside computing incorrect text wrapping in RTL writing modes. (56890238)
Fixed flex layout to use the used flex-basis instead of the specified value for definiteness evaluation. (85707621)
Fixed an issue where the outline offset was too large for outline: auto on macOS. (94116168)
Fixed an issue where element positioning was incorrect when the containing block was an anonymous block. (96548847)
Fixed an issue where box-shadow did not work on display: table-row elements. (96914376)
Fixed text-indent with calc() containing percentages to correctly treat percentage components as zero for intrinsic size contributions. (97025949)
Fixed an issue where out-of-flow content had an incorrect height when set to fit-content. (97492632)
Fixed an issue with percentage size resolution in flex items in quirks mode. (100183902)
Fixed an issue where clip-path: inset() border-radius values did not render correctly at certain element and clip-path sizes. (110847266)
Fixed -webkit-box flexbox emulation not sizing children correctly inside <fieldset> elements. (114094538)
Fixed: Improved performance on pages using :where and :is selectors. (114904007)
Fixed an issue where elements with display: table could have incorrect layout when borders were present. (116110440)
Fixed font-family serialization to preserve quotes around family names that match CSS-wide keywords or generic families. (125334960)
Fixed an issue where elements with border, position: absolute, and aspect-ratio: 1 were not rendered as squares. (126292577)
Fixed an issue where perspective-origin failed to resolve var() references when used as the second value, preventing animations from being applied. (131288246)
Fixed :focus-visible incorrectly matching after a programmatic focus() call triggered by clicking a button with child elements. (134337357)
Fixed an issue where the bottom margin of a last child element collapsed out of a parent with min-height. (134356544)
Fixed a performance issue where pages with many DOM manipulations and complex :has() selectors could freeze. (138431700)
Fixed an issue where a font was downloaded despite no characters in the document falling within its unicode-range. (140674753)
Fixed an issue where @media (prefers-color-scheme: dark) inside an iframe did not match when the iframe’s color-scheme was set to dark. (142072593)
Fixed an issue where background-clip: text did not work on table header elements. (142812484)
Fixed an issue where width: 0 did not collapse a table cell to its minimum size. (142814603)
Fixed an issue where :has(:empty) continued to match after the targeted element’s content was dynamically changed to no longer be empty. (143864358)
Fixed an issue where floats and out-of-flow objects could be incorrectly adjacent to anonymous blocks. (144481961)
Fixed an issue where text gradually disappeared when toggling text-transform on elements with ::first-letter styling. (145550507)
Fixed an issue where height: max-content resolved to zero on absolutely positioned elements when a child had max-height: 100%. (147333178)
Fixed an issue where tables with collapsed borders incorrectly calculated the first row width, causing excess border width to spill into the table’s margin area. (149675907)
Fixed an issue where an inline-flex container with flex-direction: column did not update its width to match the intrinsic size of a child image when the image was not cached. (150260401)
Fixed CSS zoom interacting incorrectly with font-weight, font-style, and font-variant on iPad. (152173269)
Fixed an issue where non-replaced elements with aspect-ratio enforced the automatic minimum size even when min-width was explicitly set to 0. (156837730)
Fixed an issue where an element can’t anchor to its previous sibling. (162903640)
Fixed :has() style invalidation performance for selectors where :has() is in non-subject position. (163512170)
Fixed an issue where RTL grid scrollable areas did not correctly account for grid layout and scrollbars. (167792896)
Fixed pixel snapping to be applied consistently for all border-width value types. (168240347)
Fixed rendering of linear gradients when all color stops are at the same position. (169063497)
Fixed an issue where insetbox-shadow was incorrectly positioned on table cells with collapsed borders. (169254286)
Fixed position-try-order to interpret logical axis values using the containing block’s writing mode instead of the element’s own writing mode. (169501069)
Fixed an issue where children with percentage heights inside absolutely positioned elements using intrinsic height values (fit-content, min-content, max-content) incorrectly resolved against the containing block’s height instead of being treated as auto. (171179193)
Fixed an issue where percent-height replaced elements computed stale preferred widths in shrink-to-fit containers. (171184282)
Fixed a regression where @scope styles did not apply to slotted elements in web components. (171383788)
Fixed an issue where the table cell nowrap minimum width calculation quirk was applied outside of quirks mode. (171410252)
Fixed a performance issue where contain: layout caused significantly slower forced layouts when all siblings created their own formatting context. (171545381)
Fixed an issue where dynamically inserting text before existing content did not update ::first-letter styling. (171649994)
Fixed an issue where underlines were split when a ruby base was expanded due to long ruby text. (171653095)
Fixed an issue where changing color-scheme did not repaint iframe background. (171658244)
Fixed an issue where nested children of a popover element failed to render when using position: absolute. (171735933)
Fixed an issue where color: initial resolved to the wrong color when the system is in dark mode. (172320282)
Fixed an issue where an element with display: contents did not establish an anchor scope when using anchor-scope. (172355302)
Fixed an issue where ordered list numbers with large starting values were clipped off-screen. (172515216)
Fixed <general-enclosed> in media queries to reject content with unmatched close brackets per the <any-value> grammar. (172575115)
Fixed an issue where the rlh unit was double-zoomed with evaluation-time CSS zoom. (172798163)
Fixed an issue where anchor-positioned elements anchored to children of sticky-positioned boxes did not stick correctly. (172884148)
Fixed an issue where pseudo-elements were not sorted correctly when sorting anchor elements by tree order. (173032203)
Fixed outline: auto to correctly respect zoom. (173068660)
Fixed outline-offset to work correctly with outline: auto on iOS. (173130230)
Fixed :active, :focus-within, and :hover pseudo-classes to correctly account for elements in the top layer. (173145294)
Fixed a regression where the ic length unit was incorrectly affected by page scaling. (173198587)
Fixed the shape() function to omit default control point anchors in computed value serialization per the CSS Shapes specification. (173233716)
Fixed: Updated SVG and MathML user agent style sheets to use :focus-visible instead of :focus. (173321368)
Fixed an issue where lh and rlh units resolved with double-zoom when line-height was a number value. (173448638)
Fixed outline-width to be ignored when outline-style is auto, matching the specification. (173567890)
Fixed :in-range and :out-of-range pseudo-classes for time inputs with reversed ranges. (173589851)
Fixed :placeholder-shown to correctly match input elements that have an empty placeholder attribute. (173604635)
Fixed an issue where ligatures caused a non-zero layout width for text with font-size: 0. (173840866)
Fixed computed value of auto insets or margins as returned by getComputedStyle() to be zero, if the element uses position-area or anchor-center. (173885561)
Fixed position-area not being able to anchor to an element positioned using anchor functions. (173964030)
Fixed :in-range and :out-of-range pseudo-classes to correctly update when the readonly attribute changes. (173978657)
Fixed an issue where view-timeline-inset serialization failed to coalesce identical values. (174096313)
Fixed CSS variable cycle detection to match the CSS Values Level 5 specification. (174105259)
Fixed url() token serialization in CSS custom properties. (174144616)
Fixed text-autospace to correctly handle supplementary Unicode characters. (174148315)
Fixed an issue where flex items with different order values caused incorrect baseline alignment. (174241817)
Fixed an issue where hovering over ::first-letter text showed a pointer cursor instead of the expected I-beam cursor. (174258447)
Fixed an issue where display: grid on a <fieldset> element added extra unnecessary space below its content. (174301311)
Fixed outline radii rendering for elements with a non-auto outline-style. (174328839)
Fixed an issue where aspect-ratio was not honored when the page was zoomed in. (174361289)
Fixed replaced elements to use the transferred size through intrinsic aspect ratio for min-content and max-content sizing. (174386310)
Fixed an issue where height: 100% on a child element altered the layout when the parent’s height was defined via aspect-ratio. (174448267)
Fixed margin collapse to be allowed when the preferred block size behaves as auto, per the CSS Sizing specification. (174547610)
Fixed an issue where document.styleSheets and shadowRoot.styleSheets incorrectly included adopted style sheets, which per the CSSOM specification should only appear in the final CSS style sheets list used for style resolution. (174583340)
Fixed the CSSOM preferred style sheet set name to be established at sheet creation time based on insertion order rather than tree order. (174586058)
Fixed highlight pseudo-elements such as ::selection and ::highlight to disallow vendor-prefixed properties, aligning with the CSS Pseudo-Elements specification. (174590593)
Fixed cycle detection and nested function call handling in CSS custom functions. (174609179)
Fixed FontFace.loaded to reject when a local() font source fails to load. (174631384)
Fixed an issue where word-break: break-all incorrectly allowed CJK close punctuation to appear at the start of a line. (174656971)
Fixed an issue where word-break: keep-all incorrectly suppressed line break opportunities at CJK punctuation characters. (174658701)
Fixed the FontFace constructor to reject with a SyntaxError instead of a NetworkError when a BufferSource fails to parse, per the CSS Font Loading specification. (174669738)
Fixed the FontFacefamily attribute to return the serialization of the parsed value. (174698351)
Fixed grid layout to correctly handle percentage and calc() values for the specified size suggestion. (174863227)
Fixed :has() sibling invalidation issues related to relation forwarding. (175006235)
Fixed an issue where min-width: auto was not correctly computed for flex items. (175157619)
Fixed an issue where percentage heights inside flex items did not resolve correctly in quirks mode. (175158571)
Fixed an issue where margin-trim: block-start did not apply to blocks nested inside inline boxes. (175162899)
Fixed an issue where dynamically changing display: contents on a <fieldset> legend caused incorrect rendering. (175163337)
Fixed: Improved :has() invalidation performance by including the full selector context in invalidation selectors. (175177078)
Fixed the CSS preload scanner to resolve relative @import URLs against the <base> element URL. (175305190)
Fixed -webkit-box flex distribution for children with orthogonal writing modes. (175323734)
Fixed calc(infinity) as a flex-grow factor not stretching a flex item to 100% width. (175431146)
Fixed :has() sibling invalidation failing due to an internal bitfield overflow, causing stale styles when siblings are added or removed. (175433733)
Fixed :has() invalidation for sibling combinators when elements are inserted or removed from the DOM. (175441568)
Fixed transition-property not preserving the specified case of <custom-ident> values during serialization. (175467206)
Fixed the will-change property not serializing correctly when used with non-property identifiers or identifiers in a non-standard case. (175482352)
Fixed percentage top and bottom values on relatively positioned elements not resolving when the containing block has aspect-ratio. (175502356)
Fixed: Updated the enhanced <select> element to use self-keywords for anchor positioning. (175505107) Fixed text-indent computation when tab stop positions are involved. (175529961)
Fixed calc() margin computations in flex layout. (175532405)
Fixed calc() margin computations for block, fieldset, and table caption layouts. (175548980)
Fixed handling of <li>value attributes in reversed ordered lists. (175558324)
Fixed CSS trigonometric functions to correctly convert degrees to radians. (175575617)
Fixed sibling-index() and sibling-count() inside calc() functions to be correctly simplified. (175590806)
Fixed sibling-index() and sibling-count()to correctly return 0 when used in cross-tree ::part() styling. (175592607)
Fixed the CSS resize handle not working on an element when the handle overlaps a child iframe. (175621855)
Fixed flex container baseline alignment being incorrectly computed for scroll containers by clamping to the border edge. (175631095)
Fixed an issue where inline-level boxes with calc() margins or padding lost the fixed component during intrinsic width computation. (175669222)
Fixed floats with margin-start incorrectly overlapping adjacent floats. (175669464)
Fixed aspect-ratio calculations for block-level elements with size constraints. (175669713)
Fixed aspect-ratio calculations for flex items with percentage cross-size constraints. (175669774)
Fixed aspect-ratio calculations for flex items with definite cross-size values. (175690028)
Fixed revert-layer computing incorrectly when there is a leading empty or space substitution value. (175729680)
Fixed an issue where flex items with explicit min-height: min-content were incorrectly treated as scrollable, zeroing out their minimum size. (176173688)
Fixed :has() invalidation performance when used inside nested :is() selectors. (176354723)
Fixed sibling-count() & sibling-index() used in @keyframes to re-resolve when siblings change. (176531901)
Fixed an issue with a collapsed border color mismatch when the table cell has a different writing-mode. (173655092)
Scroll Anchoring
Scroll anchoring is now supported in Safari 27 beta. When content is inserted or removed above the current viewport position — an image loads, an ad injects, a comment appears — the browser automatically adjusts the scroll position so the content you’re reading stays put instead of jumping.
This is an improvement you’ll feel on many sites, especially ones with lazy-loaded images, infinite-scroll feeds, or dynamically injected content. Most sites get this for free — no opt-in required.
Scroll anchoring is controlled by the overflow-anchor CSS property, which defaults to auto. If you have a specific element where you need to opt out of scroll anchoring, set overflow-anchor: none.
Additional bug fixes:
Fixed an issue on iOS where calling scrollTo during a momentum scroll incorrectly interrupted the scroll, ensuring that momentum scrolling continues as expected and smooth scrolling behaves properly. (41949531)
Fixed an issue on iOS where programmatic smooth scrolling with scroll-snap-type: mandatory failed after the browser chrome was hidden. (100727098)
Fixed an issue where interrupting scroll momentum caused the scrolling container to stop rendering and hit-testing to be misplaced. (116205365)
Fixed an issue on iOS where restored scroll position was incorrect after relaunching Safari. (127308062)
Fixed an issue where tabbing in a scroll container with scroll-padding did not scroll the focused element into view. (147513379)
Fixed an issue on macOS where custom CSS scrollbars could be cut off and the scrollbar corner rect was sized incorrectly. (168566468)
Fixed rubberbanding behaving incorrectly when a site triggers a smooth scroll to the top during a rubberband. (170705188)
Fixed an issue where pages could become blank and jump to the top after dynamically loading new content when scroll anchoring was enabled. (170889205)
Fixed an issue where scroll anchoring could cause pages to scroll to negative offsets. (171221075)
Fixed an issue where pages using the Navigation API could have offset hit test locations, making elements unclickable. (171752650)
Fixed an issue on iOS where composited layers would briefly flash blank when window.scrollTo() was called synchronously with a DOM layout change. (173197381)
Fixed an issue where sticky-positioned elements could flicker rapidly after scrolling. (173680821)
Fixed an issue where scroll anchoring could cause a page to scroll to the top or bottom automatically. (173885027)
Fixed an issue where calling scrollIntoView() on a scrollable element incorrectly scrolled the element’s own contents. (174173683)
Fixed scroll anchoring interfering with rubberbanding on some websites. (175195943)
Fixed an issue on iOS where scroll position was not preserved correctly when rotating the device on right-to-left pages. (175910769)
HTML
sizes=”auto” on img
The auto keyword in the sizes attribute on <img> elements is now supported in Safari 27 beta.
When an image uses loading="lazy" and you don’t know its rendered layout width ahead of time, sizes="auto" tells the browser to calculate the size automatically based on the actual layout width once it’s known. This makes responsive images work correctly for images inside layout containers with dynamic widths.
shadowrootslotassignment attribute
Safari 27 beta adds support for the shadowrootslotassignment attribute on declarative shadow roots. This lets you configure the slot assignment mode (named or manual) directly in HTML when defining a shadow root declaratively, matching the JavaScript attachShadow({ slotAssignment: "manual" }) option.
Additional bug fixes:
Fixed an issue where an HTML map element without a name attribute did not match its associated image using the id attribute. (12359382)
Fixed sequential focus navigation to skip elements that do not meet the specification’s focusability requirements. (103370883)
Fixed viewport <meta> parsing to correctly treat form feed as ASCII whitespace per the HTML specification. (108440799)
Fixed parsing of javascript: URLs to align with the specification. (147612682)
Fixed an issue where a third nested <iframe> using the srcdoc attribute did not render. (167917471)
Fixed incorrect parsing of pixel-length margin attributes on <body>, <iframe>, and <frame> elements. (171240848)
Fixed an issue where replaceWith() stopped processing remaining nodes if a script in the replacement removed a sibling. (172753019)
Fixed an issue where HEIC images were incorrectly converted to JPEG when uploaded via drag-and-drop or file input. (173206598)
Fixed the HTML preload scanner to skip preloading stylesheets that have the disabled attribute. (173378582)
Fixed an issue where setting the rel attribute on an <a> element multiple times did not clear prior link relations. (173567839)
Fixed the HTML parser fast path to correctly process escaped attribute values longer than one character. (173673581)
Fixed the HTML parser fast path to correctly detect nested <li> elements. (173983892)
Fixed the HTML parser fast path to use the adjusted current node for MathML and SVG integration point checks. (174096305)
Fixed document named item collection to include all <object> elements, aligning with other browser engines. (174537345)
Fixed window.open() to correctly consume user activation when creating a new browsing context, aligning with the HTML specification. (174587258)
Fixed remaining issues with <img sizes="auto"> to fully align with the specification. (174684058)
Fixed an issue where dir=auto on <slot> elements did not update when slotted content changed. (174871706)
Fixed an issue where <option> elements rendered incorrectly when the label attribute was empty. (174979446)
Fixed an issue where the preload scanner incorrectly skipped <source> elements with an empty type attribute inside <picture>. (175094037)
Fixed innerText to emit a newline for empty <option> or <optgroup> inside <select>. (175245381)
Fixed HTML floating-point number parsing to correctly handle values with a leading + sign. (175300431)
Fixed innerText to no longer emit newlines for visibility: hidden block elements. (175569426)
Fixed innerText to correctly emit blank lines around <p> elements regardless of their CSS display value. (175729427)
Fixed the speculative preload scanner to no longer incorrectly preload scripts inside SVG elements. (175800116)
Fixed innerText on tables to no longer emit spurious trailing newlines and to preserve row-exit newlines after empty rows. (176635985)
Fixed an issue where inserting an image with a srcset attribute into a dynamically created iframe resulted in an invisible image. (66849050)
Fixed naturalWidth and naturalHeight returning incorrect values for SVG images without intrinsic dimensions. (141196049)
Fixed an issue where HDR images would flicker and lose their HDR appearance when overlapping layers animate. (163382580)
Fixed an issue where adopting a standalone img element did not update its image data. (172856773)
JavaScript
Top-Level Await
Safari 27 beta includes a complete standards-compliant rewrite of the ECMAScript module (ESM) loader. The new loader is implemented in native C++ and conforms directly to the ECMAScript specification’s module loading algorithms, replacing an earlier implementation based on an abandoned 2016 WHATWG Loader proposal that predated top-level await entirely.
The rewrite fixes module execution ordering and initialization issues that could cause imports to access exports before they were fully evaluated. It was validated against test262, the Web Platform Tests, and additional test cases.
Top-level await is a foundational feature of modern JavaScript module authoring, and it’s been a real pain point in Safari for a while — a known source of cross-browser bugs that developers building module-based apps had to work around. This fix closes that gap.
Additional bug fixes:
Fixed multiple top-level await correctness bugs with a rewrite of the ES module loader for standards compliance. (97370038)
Fixed regular expressions in Unicode mode to not count non-capturing groups and modifiers toward the number of available backreferences. (167746769)
Fixed %TypedArray%.prototype.subarray to calculate beginByteOffset correctly to align with ECMA-262. (168143600)
Fixed the trace behavior of RegExp.prototype[Symbol.split] to align with ECMA-262. (168288878)
Fixed Array.prototype.concat to correctly handle arrays with indexed accessors, preventing getter reentry from bypassing Symbol.isConcatSpreadable checks. (172237596)
Fixed an issue where a greedy or non-greedy non-BMP character class in a regular expression could advance the index past the end of input. (172978772)
Fixed an issue where class instance field initializers did not have the correct evaluation context when used inside arrow functions and nested scopes. (173296563)
Fixed TypedArray [[Set]] to check the receiver before writing to the typed array. (173386404)
Fixed %ArrayIteratorPrototype%.next() to return { done: true } instead of throwing a TypeError when the source TypedArray is detached and the iterator has already completed. (173759106)
Fixed an issue where a fixed-count mixed-width character class in a regular expression did not correctly restore the index on backtrack. (173972458)
Fixed an issue where regular expressions with non-BMP characters could skip valid match positions when alternating between patterns. (174200307)
Fixed an issue where regular expression captures were not properly cleared when backtracking out of fixed-count parenthesized groups and negative lookaheads. (174201284)
Fixed an issue where import { "*" as x } was incorrectly treated as a namespace import instead of a named import using the string “" as a ModuleExportName. (174314099)
Fixed an issue where RegExp.prototype.exec and RegExp.prototype.test could match against a stale pattern if lastIndex has a valueOf that calls RegExp.prototype.compile. (174461752)
Fixed an issue where async functions using module-scoped variables could fail when the DFG JIT optimized scope resolution. (174626957)
Fixed an issue where Intl.Segmenter with granularity: "word" incorrectly reported isWordLike: false for numeric segments. (175057894)
Fixed Object.defineProperties to call Proxy traps in the correct order. (175068687)
Fixed an issue where Intl.Locale did not canonicalize before overriding the language. (175092327)
Fixed time zone identifiers to return primary IANA time zone IDs instead of legacy ICU identifiers. (175098682)
Fixed Intl.DateTimeFormat to preserve the original legacy timezone identifier instead of replacing it with the primary IANA ID. (175206605)
Fixed Promise.prototype.finally to throw a TypeError when @@species is not a constructor, matching the behavior of other browsers. (175290627)
Fixed the regular expression engine to reject dangling hyphens in character class syntax when using the /v flag. (175559808)
Fixed a performance issue with module resolution by limiting cache population to star-resolution and indirect-resolution cases. (175826413)
Fixed a performance issue with TypedArray.prototype.lastIndexOf by adding SIMD-accelerated reverse search for numeric types. (175904377)
Fixed a performance issue where building a module namespace with many exportstatements was significantly slower than necessary. (175949532) Fixed DataView constructor to match specification-defined argument validation order and error throwing behavior. (176110210)
Fixed an issue where Array.prototype.concat could produce incorrect results when combining arrays with incompatible indexing types. (176219964)
WebAssembly
JavaScript Promise Integration (JSPI)
Safari 27 beta adds support for WebAssembly JavaScript Promise Integration (JSPI). JSPI lets synchronous-looking WebAssembly code suspend and wait for JavaScript Promises, making it much easier to port existing C, C++, Rust, and other language code to the web where that code expects synchronous I/O.
Before JSPI, porting code that called synchronous APIs to Wasm required rewriting everything on top of a callback or async state machine. With JSPI, the Wasm module can suspend at a call site and resume when the Promise resolves — the rest of the module sees straight-line synchronous code. This is a significant capability for the Wasm ecosystem.
Additional bug fixes:
Fixed WebAssembly.Suspending and WebAssembly.SuspendError to be data properties instead of getter functions, aligning with other WebAssembly attributes like WebAssembly.Module. (170155726)
Fixed incorrect IntegerOverflow exceptions thrown by i32.rem_s, i64.rem_s, i32.div_u, i64.div_u, i32.rem_u, and i64.rem_u when both operands are constants. (175122462)
Fixed a regression where RegisterSet::normalizeWidths() lost vector-width information, causing v128 argument corruption in WebAssembly SIMD thunks. (176035764)
MathML
Multiple-character operators in MathML
Safari 27 beta now supports multiple-character operators in MathML, improving the rendering of complex mathematical notation that uses operators like ++, :=, /=, and similar. We also updated operator dictionary to MathML Core, so that we also support multi-character, combining character, and updated operator dictionary.
tabindex, focus(), blur(), and autofocus on MathML
Safari 27 beta now supports tabindex, focus(), blur(), and autofocus on MathML elements, improving MathML feature parity’s with HTML. This makes math content fully participate in keyboard navigation and focus management, which supports interactive educational content and accessibility.
Additional bug fixes:
Fixed an issue where symmetric non-stretchy large operators were not centered around the math axis. (170905663)
Fixed an issue where dynamic changes to <mo> element attributes did not trigger a relayout. (170907029)
Fixed an issue where minsize and maxsize defaults and percentages did not use the unstretched size as specified. (170908253)
Fixed positioning of the <mprescripts> element within <mmultiscripts> layout. (170909975)
Fixed an issue where the MathML fraction bar was not painted when its thickness was equal to its width. (170934351)
Fixed an issue where <none> and <mprescripts> elements were not laid out as <mrow> elements in MathML. (170940035)
Fixed an issue where MathML token elements ignored -webkit-text-fill-color when painting math variant glyphs. (172020318)
Fixed padding and border rendering on <msqrt> and <mroot> elements and corrected token sizing for mathvariant. (173081436)
Fixed absolute positioning of elements inside MathML by ensuring logical height is updated. (173088146)
Fixed tabIndex values not being set correctly for MathML elements. (174734133)
Spatial Web
Immersive website environments in visionOS
Safari 27 beta in visionOS 27 adds support for immersive website environments. Developers can now provide incredible immersive experiences with a simple <model> element and one JavaScript API call. The Immersive API on the model element works similarly to how the Fullscreen API does on video elements. Learn more in the WWDC26 session Explore immersive website environments in visionOS.
Consider what this makes possible in a browser: a ticketing site where you can see the view from your seat before you buy, or a hotel that lets you walk the room, all built with standard web technology, no app required.
img controls on spatial and panorama photos
Safari 27 beta in visionOS 27 adds support for the controls attribute on <img> elements displaying spatial and panorama photos. When applied, the image gets native interactive controls appropriate for the content type, allowing the image to be viewed spatially or immersively wrapped around the user.
model on iOS, iPadOS, and macOS
The <model> HTML element is now available in Safari on iOS, iPadOS, and macOS, joining its existing availability in visionOS. Web developers can now embed interactive 3D content using standard HTML across Apple platforms.
Safari 27 beta adds support for dynamic-range-limit on the <model> element, giving you control over the HDR rendering range for 3D content in iOS and macOS.
Additional bug fixes:
Fixed spatial and panoramic image controls to support RTL language layout and localization of type labels. (161690817)
Fixed <model> elements displaying at 100x the expected size for assets authored in tools that use centimeter units. (167805672)
Fixed an issue where WebXR viewports did not get an initial value until getViewport() was called. (168125694)
Fixed an issue where the <model> element stagemode orbit physics behaved differently between iOS and visionOS. (172189776)
Fixed an issue on visionOS where fullscreen video would sometimes jump when exiting fullscreen if the browser window was narrower than the video. (174454557)
WebGPU
Safari 27 beta now supports the clip_distances built-in value in WGSL shaders. Clip distances are a WebGPU feature that allows vertex shaders to define custom clipping planes, enabling you to discard geometry on one side of an arbitrary plane before rasterization occurs.
Additional bug fixes:
Fixed compressedTexImage not validating whether the compressed texture format extension has been enabled. (175652171)
Fixed some texImage functions reporting errors with incorrect function names. (175652807)
Fixed some WebGL context state properties not being correctly reset on context loss. (176190808)
Fixed GPUDevice.onuncapturederror event handler attribute not working. (149577124)
Fixed: Restored maxStorageBuffersInFragmentStage and related WebGPU limits. (160800947)
Fixed rendering failing when using direct GPUTexture objects instead of GPUTextureView with multisampled resolve targets in render passes. (175452924)
Media
TextTrackCue.endTime = Infinity
Safari 27 beta supports setting TextTrackCue.endTime to Infinity to represent an unbounded cue duration. It’s useful for captions or data cues of live streams.
Additional bug fixes:
Fixed an issue where decoding WebM audio files with more than two channels would fail. (82160691)
Fixed an issue where preservesPitch and playbackRate were not correctly handled on an HTMLMediaElement connected to an AudioContext via createMediaElementSource. (93275149)
Fixed MediaCapabilities.decodingInfo() incorrectly reporting VP8 in WebM as not supported. (127339546)
Fixed an issue on iPad where exiting fullscreen on a media document incorrectly navigated back to the previous page instead of returning to the inline view. (137220651)
Fixed an issue where the WebCodecs VideoDecoder API output frames in an incorrect order for videos containing B-frames. (145093697)
Fixed an issue where the darkening overlay on inline video controls made accurate scrubbing difficult and displayed video content incorrectly on macOS. (161271114)
Fixed an issue where WebM with VP9/Vorbis fallback would not play. (164053503)
Fixed video playback failing when the declared MIME type in a <source> element does not match the actual content type served by the server. (166181001)
Fixed an issue where text selection was broken after pausing a video when the media player ran in the content process. (167727538)
Fixed HTMLMediaElement.currentTime to report smoothly progressing values instead of updating only at fixed intervals. (170115677)
Fixed an issue where MP4 files containing Opus audio tracks could not be decoded with decodeAudioData. (170196423)
Fixed an issue where the VideoFrame constructor did not handle the video color range correctly for NV12 (I420 BT601) video frames. (170299037)
Fixed an issue where Live Text selection was unavailable on paused fullscreen videos. (170817667)
Fixed an issue where FairPlay-protected VP9 content failed to play via MediaSource. (171210968)
Fixed an issue where autoplay would proceed before default text tracks finished loading. (171699293)
Fixed the currentTime getter to return defaultPlaybackStartPosition when no media player exists. (171722368)
Fixed HTMLMediaElement to fire a timeupdate event when resetting the playback position during media load as required by the specification. (171785463)
Fixed an issue where the media player preload attribute was not properly updated when the autoplay attribute was set. (171883159)
Fixed an issue where seeking in a WebM video did not work correctly while content was still loading. (172473039)
Fixed an issue where media playback could not move to the next item in a playlist when the tab was in the background. (172676372)
Fixed an issue where scrubbing a video in full-screen mode could cause it to exit full-screen. (172682230)
Fixed an issue where HDR video content appeared washed out due to colorspace information being lost during processing. (172721079)
Fixed Encrypted Media Extensions to check support for the full content type including codecs, rather than only the MIME type. (173852931)
Fixed an issue where setting HTMLMediaElement.volume had no effect when the element was connected to an AudioContext. (174278899)
Fixed ImageCapture to correctly queue takePhoto() and applyConstraints() requests to avoid concurrent capture session reconfiguration. (174950018)
Fixed a regression where videos would stop playing and lose audio after a few seconds on some websites. (174966899)
Fixed an issue where U+0000 (NULL) characters were not allowed in VTTCue text content. (175084171)
Fixed video content disappearing after switching to another tab and back. (175257980)
Fixed WebVTT cue settings line parsing failures. (175296476)
Fixed ::cue() selectors to correctly match the WebVTT root object in addition to child nodes. (175550173)
Fixed currentTime on iOS to update more frequently during media playback. (175774587)
Fixed Media Source Extensions readyState not being updated immediately when playback stalls due to a gap in buffered data. (176330683)
Web API
Service Worker static routing API
Safari 27 beta adds support for the Service Worker static routing API. This lets a service worker declare routing rules that the browser can use to bypass the service worker entirely for certain requests, reducing overhead for high-performance PWAs.
Dedicated workers inside shared workers
Safari 27 beta adds support for creating dedicated workers inside shared workers, per the HTML Standard.
ReadableStream improvements
Safari 27 beta adds three improvements to ReadableStream:
the ReadableStream.from() static method for creating a stream from any async iterable or iterable
constvegetables= ["Carrot", "Broccoli", "Tomato", "Spinach"];
constasyncIterator= (asyncfunction* () {
yield1;
yield2;
yield3;
})();
// Create ReadableStream from the array
constmyReadableStream=ReadableStream.from(vegetables);
// Create ReadableStream from async iterator
constasyncReadableStream=ReadableStream.from(asyncIterator);
the ability to transfer a ReadableStream , WritableStream and TransformStream across contexts via postMessage()
Additional bug fixes:
Fixed the parent window’s history.state being set to null when history.pushState is called from a child iframe. (50019069)
Fixed clicking on a scrollbar of an overflow container blurring the current activeElement. (92367314)
Fixed an issue where the change event was not fired on <input> and <textarea> elements when they lost focus while another application was in the foreground. (98526540)
Fixed Web IDL bindings to correctly reject SharedArrayBuffer where [AllowShared] is not specified. (107786134)
Fixed Content Security Policy to only recognize ASCII whitespace excluding vertical tabs to align with the specification. (108559413)
Fixed emoji input on Google Docs and similar web applications by supressing keypress events for supplementary characters. (122678873)
Fixed an issue where MouseEvent.offsetX and MouseEvent.offsetY were not relative to the padding edge as specified. (125763807)
Fixed an issue on visionOS where the gamepadconnected event did not fire unless gamepad permission had already been granted. (141623162)
Fixed an issue where CSPViolationReportBody did not include the source line number in Content Security Policy violation reports. (152607402)
Fixed an issue where selecting credentials in the Digital Credentials API sometimes required a second click to trigger verification. (163295172)
Fixed window bar visibility properties (toolbar.visible, statusbar.visible, menubar.visible) to return static values per the HTML specification for privacy and interoperability. (166554327)
Fixed handling of unknown DigitalCredential protocols by gracefully filtering them out and showing a console warning instead of throwing an error. (166673454)
Fixed: Updated the Digital Credentials API to rename DigitalCredentialRequest to DigitalCredentialGetRequest per the latest specification. (167115220)
Fixed an issue where Service Worker routes were not matched when no fetch event handler was set. (167753466)
Fixed spec conformance issues in the Streams API piping and abort behavior. (167841090)
Fixed Service Worker static routing rules to enforce limitation checks as required by the specification. (167977145)
Fixed layerX and layerY to return correct values with CSS transforms. (168968832)
Fixed location.ancestorOrigins returning stale origins after an iframe is removed from the document. (169097730)
Fixed NavigateEvent.canIntercept to correctly return false when navigating to a URL with a different port, aligning with the Navigation API specification. (169845691)
Fixed NavigateEvent.navigationType to return "replace" when navigating to a URL that matches the active document’s URL. (169999046)
Fixed an issue where the dragend event had incorrect coordinates when dragging within a nested <iframe>. (170750013)
Fixed an issue where navigation.currentEntry.key did not change in private browsing windows after calling history.pushState(). (171147417)
Fixed an issue where touch event properties values were sometimes swapped with neighboring values. (171567543)
Fixed a performance issue where ResizeObserver callbacks became increasingly sluggish over time. (172718139)
Fixed a performance issue where IntersectionObserver became sluggish over time when observing many elements due to O(n²) iteration. (172727210)
Fixed an issue where navigation.currentEntry.id did not change in private browsing windows after calling history.replaceState(). (172897962)
Fixed an issue where document.open() incorrectly aliased the caller’s security origin. (173369038)
Fixed an issue where history.replaceState() on a traversed history entry incorrectly changed navigation.currentEntry.key to a new UUID instead of preserving the original key. (173388766)
Fixed an issue where Object.prototype could not be serialized by structuredClone(). (173728983)
Fixed an issue where backslashes were not handled correctly in non-special URLs. (173757759)
Fixed a URL parsing bug in the special relative or authority state. (173772241)
Fixed an issue where event listener once and passive flags were not preserved when copying listeners between elements. (173834642)
Fixed: Preserved existing listener options (such as passive defaulting) when overwriting event handler attributes. (173842822)
Fixed the Credential Management API to properly define which credential types are allowed in the same get() request. (173918198)
Fixed an issue where event.target was not set after dispatching an event in a shadow tree with no listeners. (174136382)
Fixed an issue where navigator.credentials.create() and navigator.credentials.get() discarded the AbortSignal reason and always rejected with a generic AbortError. (174220589)
Fixed Range.extractContents() to not extract out-of-bounds nodes when the end container is removed during extraction. (174307275)
Fixed document.createEvent() to throw an exception for "MutationEvents", "MutationEvent", "PopStateEvent", and "WheelEvent", aligning with other browser engines. (174339775)
Fixed ParentNode.append() to correctly de-duplicate nodes when the same node is passed multiple times. (174365465)
Fixed an issue where MutationObserver delivered childList records in the wrong order when script ran during node insertion. (174368989)
Fixed an issue where setting a URL object’s port property to whitespace behaved incorrectly. (174484035)
Fixed a missing return in the Navigation API’s performTraversal that caused incorrect behavior when traversing to an unknown key. (174513305)
Fixed Blob.slice() to correctly clamp fractional start and end parameters using round-half-to-even rounding per the File API specification, which may change how edge-case fractional values like 0.5 are rounded. (174555334)
Fixed postMessage() to validate transferable object states after serialization, aligning with the HTML specification. (174558047)
Fixed structuredClone() and window.postMessage() to correctly throw a DataCloneError when serializing a SharedArrayBuffer outside of cross-origin isolated contexts. (174562553)
Fixed an issue where calling Element.blur() on an <iframe> did not reset document.activeElement to <body>. (174591529)
Fixed document.styleSheets to be accessible on documents created by DOMParser. (174625774)
Fixed innerText getter to correctly handle trailing newlines and blank lines for <p> elements and headings. (174642704)
Fixed innerText whitespace handling at inline-block boundaries. (174713114)
Fixed XMLSerializer namespace handling to correctly serialize elements with namespace prefixes. (174726401)
Fixed the innerText getter to preserve newlines for elements with white-space: pre-line. (174727341)
Fixed service worker registrations to be unregistered when the main script is missing. (174755909)
Fixed innerText handling of replaced elements at block boundaries. (174816319)
Fixed EventSource to be closed when window.stop() is called. (174830925)
Fixed service worker registrations to be unregistered when failing to retrieve stored imported scripts. (174833692)
Fixed calling preventDefault() during a pointerdown event to correctly suppress mousedown and mouseup events on iOS. (174864309)
Fixed innerTextto not fall back totextContentfor elements withdisplay: contents`. (174883499)
Fixed innerText to preserve the contents of <option> elements inside <select>. (175006854)
Fixed Element.innerText to collect option text when called directly on a <select> element. (175156630)
Fixed worker scripts to always be decoded as UTF-8, as per the specification. (175327455)
Fixed an issue where an Event object’s target property could lose its JavaScript wrapper due to premature garbage collection. (175439759)
Fixed an issue where ancestors of TreeWalker.currentNode could be prematurely garbage collected. (175442228)
Fixed FileSystemDirectoryHandle.resolve() to return the correct path array for child entries. (175645387)
Fixed PerformanceNavigationTiming.domInteractive and domContentLoadedEventEnd incorrectly returning 0 instead of the correct timestamps. (175739835)
Fixed FileSystemDirectoryHandle.removeEntry() to correctly remove entries. (175745157)
Fixed CryptoKey to correctly remain associated with its secure context. (176157712)
Fixed: Improved cross-origin isolation enforcement for workers. (176175488)
Fixed SharedArrayBuffer cloning and agent cluster ID assignment. (176465817)
Rendering
srgb-linear and display-p3-linear
Safari 27 beta adds srgb-linear and display-p3-linear to predefined color spaces, making these linear-light color spaces available in Canvas, WebGL, and other APIs.
Subpixel inline layout
Subpixel inline layout is now available in Safari 27 beta. Text and inline elements can now be positioned with device-pixel precision, improving layout accuracy in block direction.
You don’t need to do anything to benefit. Layout engines have been moving in this direction for years; Safari 27 brings inline layout up to that bar.
Additional bug fixes:
Fixed an issue where a 2D canvas element unnecessarily forced a compositing layer. (172864747)
Fixed an issue where table cells with rowspan values exceeding the actual number of rows were incorrectly computing heights. (3209126)
Fixed an issue where ::first-letter styles caused Range.getClientRects() and Range.getBoundingClientRect() to return incorrect dimensions. (71546397)
Fixed incorrect distributed height in table rows when a <td> element has an explicit height set. (78549188)
Fixed an issue where U+2028 LINE SEPARATOR was not rendered as a forced line break. (88470339)
Fixed an issue where a block formatting context with margin-start could overlap an adjacent float. (93187697)
Fixed position: relative on table rows (<tr>) to correctly establish a containing block for absolutely positioned descendants. (94294819)
Fixed <marquee> elements causing incorrect table width calculations. (99826593)
Fixed boxes in the top layer to use the initial containing block as their static-position rectangle. (155495104)
Fixed an issue where a flex item containing a percentage-height image did not shrink correctly around the image. (156902823)
Fixed an issue where form controls with height: 100% in auto-height containers incorrectly resolved to zero height. (161699543)
Fixed incorrect box sizing on inline elements when they have no siblings and their padding-left plus margin-left equals zero. (162376969)
Fixed a regression where an element inside an iframe gaining its own compositing layer could cause an iframe’s semi-transparent background to appear darker.(163509267)
Fixed an issue where space-taking scrollbars did not trigger a proper re-layout when the box size depends on content size. (166836126)
Fixed an issue where View Transition snapshots were incorrectly stored in sRGB, causing rendering issues with non-sRGB colors. (167634138)
Fixed an issue where font subpixel quantization was unnecessarily disabled in some cases, improving text rendering quality. (168088611)
Fixed table layout to properly handle visibility: collapse on columns. (168556786)
Fixed intrinsic sizing for absolutely positioned replaced elements. (168815514)
Fixed text being incorrectly truncated in RTL containers when combined with text-overflow: ellipsis and an inline-block pseudo-element. (168875614)
Fixed percentage padding in table cells to resolve against column widths. (168940907)
Fixed a regression where hovering over elements could leave repaint artifacts on the page. (169112402)
Fixed table height distribution to apply to tbody sections instead of only the first section. (169154677)
Fixed an issue where table sections with explicit heights did not properly constrain and distribute space among contained rows. (169235210)
Fixed an issue where images with min-width: fit-content rendered at an incorrect width. (169359566)
Fixed an issue where height: 100% was incorrectly calculated for replaced elements like images serving as grid items nested inside a flexbox. (169431440)
Fixed an issue where images were incorrectly stretched in certain page layouts. (170270187)
Fixed an issue where Find in Page scrolled to the wrong location when matching text inside elements with user-select: none. (170477571)
Fixed the baseline calculation for inline-block elements so that when overflow is not visible, the baseline is correctly set to the bottom margin edge. (170575015)
Fixed an issue where replaced elements did not correctly apply min-height and min-width constraints in certain configurations. (170765025)
Fixed an issue where overlay backgrounds would briefly dim incorrectly when de-compositing in a scrollable container. (171024685)
Fixed a regression where sticky-positioned elements inside overflow containers could appear in front of content that should overlap them. (171179878)
Fixed an issue where auto table layout did not honor max-width on table cells when distributing width between them. (171459245)
Fixed an issue where border-spacing incorrectly included collapsed columns in auto table layout calculations. (171468102)
Fixed an issue where percentage-height children of table cells with unresolvable percentage heights were not sized intrinsically. (171469500)
Fixed an issue where cell backgrounds in collapsed-border tables extended into adjacent cells’ border space at table edges. (172068907)
Fixed an issue where if a document in an iframe uses @prefers-color-scheme, it does not follow the color-scheme set by grandparents of the iframe. (172229372)
Fixed an issue where list item margins were computed incorrectly when the page was zoomed in or out. (172312498)
Fixed an issue where about:blank iframes did not always have a transparent background. (172400258)
Fixed an issue where a right-floated table could overlap another table. (172655655)
Fixed an issue where grid containers failed to avoid float boxes. (172655720)
Fixed an issue where an anonymous block created for list markers was not properly collapsed when block content prevented line-box parenting. (172686060)
Fixed an issue where checkboxes could overlap with adjacent text. (172741572)
Fixed an issue where checkbox outlines appeared misaligned. (172742551)
Fixed an issue where list markers rendered on the wrong line when list items started with empty inline elements. (172762578)
Fixed an issue where U+2029 PARAGRAPH SEPARATOR was not treated as a forced line break. (173106856)
Fixed an issue where tiles were missing after navigating back in history. (173288233)
Fixed an issue where view transition snapshots could capture stale transform values for accelerated CSS transform animations. (173323193)
Fixed an issue with outside list markers when blockification prevents line-box parenting. (173417560)
Fixed a regression where nested empty inline boxes accumulated an incorrect vertical offset, causing inline elements to stack as block-level elements. (173723162)
Fixed an issue where pseudo-elements were incorrectly included in outline rect collection. (174033087)
Fixed an inverted Y-axis comparison that could cause incorrect caret positioning. (174144220)
Fixed an issue where <br> elements with line-height: 0 still created extra vertical space, failing to respect the declared line height. (174400946)
Fixed auto outlines to more closely follow the border radii of elements. (174466854)
Fixed how gradients are renderer to improve performance. (174880197)
Fixed image-orientation being ignored for background-image, border-image, and list-style-image. (174894122)
Fixed a white-space: pre-wrap layout issue with justified text. (174937310)
Fixed an issue where minimum height was not correctly computed for flex items. (174999995)
Fixed an issue with flex-wrap and flex factor computation for wrapping flex items. (175012395)
Fixed vertical writing-mode content incorrectly wrapping when the parent has auto height. (175123356)
Fixed minimum height calculation for flex items. (175195518)
Fixed incorrect bounding box position for newline characters. (175243361)
Fixed an issue where a child element with filter: blur() ignored border-radius overflow clipping from its parent. (175519148)
Fixed an issue where absolutely positioned tables with content exceeding their declared width were incorrectly positioned. (175755871)
Fixed height calculations for absolutely positioned tables with percentage-sized children. (175762381)
Fixed an issue where containers with block-in-inline content did not expand when max-height was removed. (175799547)
Fixed an issue where absolutely positioned tables with explicit percentage or fixed heights did not resolve correctly against their containing block. (175852400)
Fixed always-on scrollbar thumbs not rendering on the root element of nested documents with display: flex. (175866046)
Fixed absolutely positioned tables ignoring min-height and shrinking below their content height. (175883577)
Fixed scrollbar-gutter placement on the root element in RTL layouts. (175939512)
Fixed an issue where a flex item with aspect-ratio and content-box padding computed the wrong height in a column flex container. (176033726)
Fixed an issue where block-level boxes nested within inline elements were not properly aligned when using align-content: center. (176173122)
Fixed intrinsic sizing for non-replaced elements with percentage dimensions. (176493856)
Fixed an issue where panning a zoomed-in PDF on iOS would frequently rubber band back to the starting position. (156854435)
WebRTC
Safari 27 beta adds support for the targetLatency attribute in WebRTC, for specifying a target latency on a receiver. It adds support for the RTCRtpCodec dictionary and related constructs, improving the ability to inspect and configure codecs. It adds support for RTCRtpReceiver.jitterBufferTarget, for tuning the jitter buffer. And it adds video source width and height to RTC stats.
Additional bug fixes:
Fixed an issue where I420 BT709 VideoFrame was encoded in an incorrect color space when encoding to VP9. (169425608)
Fixed an issue where RTCPeerConnection.addIceCandidate() did not reject when the connection was already closed. (170470988)
Fixed an issue where RTCDataChannel did not check the SCTP buffered amount synchronously. (172386678)
Fixed an issue where MediaStreamTrack could have incorrect settings if the source settings changed while the track was being transferred. (172657570)
Fixed an issue where a remote WebRTC track was not unmuted when the first packet was received. (172904930)
Fixed validation of RTC send encodings to better align with the specification. (172997814)
Fixed an issue where RTCRtpSender.setParameters did not clear parameters that were unset by the web application. (173678165)
Fixed a regression where RTCPeerConnection with iceTransportPolicy: "relay" failed to gather ICE candidates. (174794660)
Fixed RTCInboundRtpStreamStats.trackIdentifier to match MediaStreamTrack.id. (174938984)
Web Extensions
The runtime.getDocumentId() Web Extension API now has support in Safari 27 beta. It adds reporting of uncaught JavaScript exceptions and unhandled promise rejections in Web Extension scripts, making extensions easier to debug. And it adds support for propagating user gestures through sendMessage(), connect(), postMessage(), and executeScript() — so extensions can reliably perform actions like media playback that require user activation.
Additional bug fixes:
Fixed browser.i18n.getMessage() to correctly substitute named placeholders when they appear adjacent to non-space characters. (169146196)
Fixed browser.i18n.getMessage() to correctly substitute two adjacent named placeholders. (175315700)
Fixed an issue where web extension service worker registration database files accumulated on each Safari launch, causing performance degradation. (175484888)
Networking
Secure cookies on loopback
Safari 27 beta adds support for Secure cookies on loopback hosts. For loopback hosts using plaintext HTTP, cookies marked Secure can now be set via JavaScript and Set-Cookie headers, matching the behavior of other browsers. This simplifies local development and testing with Secure cookies.
Additional bug fixes:
Fixed redirects to data: URLs to be blocked for subresources such as images and scripts, aligning with the Fetch specification. (74165956)
Fixed XMLHttpRequest incorrectly dropping the request body during redirects. (98459882)
Fixed X-Frame-Options to only strip tab or space characters, not vertical tabs. (126915315)
Fixed an issue where Safari’s address bar could display an internationalized domain name (IDN) homograph as a visually identical legitimate Latin domain, enabling potential phishing attacks. (166796168)
Fixed an issue where the preload scanner did not include integrity metadata in requests, causing incorrect Integrity-Policy violation reports. (168280745)
Fixed range request validation to properly handle HTTP 416 (Requested Range Not Satisfiable) responses. (168487440)
Fixed a regression where the referrer could be missing after a process-swap navigation. (169006635)
Fixed incorrect URL query percent-encoding when using non-UTF-8 character encodings such as iso-8859-2, windows-1250, and gbk. (169566553)
Fixed an issue where the multipart form data parser incorrectly required CRLF after the closing delimiter, causing some web applications to fail to render correctly. (174348783)
Fixed an issue where partitioned cookies could not be deleted via WKHTTPCookieStore. (174557252)
Storage
maxAge in the Cookie Store API
Safari 27 beta now supports specifying maxAge when setting a cookie via the Cookie Store API.
awaitcookieStore.set({
name:"session",
value:"abc123",
maxAge:60*60*24*7, // one week, in seconds
});
Additional bug fixes:
Fixed an issue where IndexedDB could incorrectly return a version 0 database after an abort during the initial onupgradeneeded event. (176195526)
Editing
Safari 27 beta now supports menu items that convert editable text between Simplified and Traditional Chinese characters, now available in the “Transformations” submenu of the context menu for relevant text selections.
Additional bug fixes:
Fixed an issue where characters styled with ::first-letter were not selectable. (5688237)
Fixed font size 13pt being incorrectly mapped to <font size="2"> (10pt) when using rich text editing. (15292320)
Fixed an issue where the Font Picker style selection became unusable after changing fonts when editing multiple lines of text. (110651645)
Fixed an issue where adjusting text selection with touch handles was prevented by JavaScript touch event handling on some websites. (151851274)
Fixed an issue where execCommand('FormatBlock') did not preserve inline styles of replaced block elements, causing text formatting to be lost when pasting content. (157657531)
Fixed an issue where text-indent flickered or was ignored on contenteditable elements while typing. (170280101)
Fixed an issue where text selection would jump unexpectedly when selecting absolutely-positioned content inside an element with user-select: none. (170475401)
Fixed an issue where text selection was lost when focus transitioned from a contentEditable element to a non-editable target. (171221909)
Fixed an issue where CJK encoding state was not reset appropriately during text decoding. (174649963)
SVG
Safari 27 beta adds support for the lang and xml:lang attribute in SVG. You can now specify the language of text content in SVG, enabling correct language-aware text rendering and accessibility announcements.
Additional bug fixes:
Fixed offsetX and offsetY for SVG elements to use the outermost SVG as the base for coordinate calculation. (168548585)
Fixed an issue where backslash-escaped dot characters in SVG animation timing attribute ID references were not parsed correctly. (94260935)
Fixed an issue where SMIL animations of href or xlink:href on SVG <image> elements had no visual effect. (96316808)
Fixed an issue where SVG animation did not clear the animated CSS property when attributeName was dynamically changed. (97097883)
Fixed :visited link color to properly propagate to SVG through currentColor. (98776770)
Fixed an issue where a CSS filter referencing an SVG filter via url(#id) was not invalidated when the filter content changed. (101870430)
Fixed SVG2 systemLanguage attribute to improve parsing and compliance with the specification. (116427520)
Fixed removing an item from SVGTransformList to properly allow attribute removal. (117840533)
Fixed an issue where the XML document parser did not defer inline script execution until pending stylesheets had loaded. (122574381)
Fixed an issue where animated SVG images referenced via an <img> tag did not animate correctly due to repaint artifacts with object-fit. (141815698)
Fixed an SVG <tspan> positioning bug with xml:space="preserve" that caused multi-line text to render incorrectly. (143722975)
Fixed an issue where SVG elements referencing non-existent filter IDs were not rendered. (164046592)
Fixed an issue where URL fragments were not percent-decoded before being used for SVG references. (169582378)
Fixed: Updated the default values of fx and fy attributes on SVGRadialGradientElement to 50% to align with the SVG2 specification. (169645572)
Fixed SVGAnimatedRect.baseVal to ignore invalid values set on the viewBox attribute, such as negative width or height, aligning with Firefox and Chrome. (170214971)
Fixed SVG length attributes to reset to their default values when removed, rather than retaining previously set values. (170360351)
Fixed an issue where getScreenCTM() did not include CSS transforms and zoom contributions in the legacy SVG rendering path. (171525696)
Fixed an issue where an invalid attribute type in one SVG animation group prevented all subsequent animation groups from running. (172593109)
Fixed a regression where wheel events were not dispatched to an empty <svg> root element. (172909441)
Fixed an issue where SMIL parseClockValue did not reject out-of-range minutes and seconds values per the SMIL timing specification. (173577212)
Fixed the SMIL values attribute to preserve empty values and handle trailing semicolons. (173594455)
Fixed SMIL repeat(n) event conditions not triggering animations. (173599629)
Fixed SVG2 getStartPositionOfChar and getEndPositionOfChar to be more compliant with the specification. (174145885)
Fixed glyph-orientation-vertical: auto to use UTR#50 Vertical Orientation properties for correct character orientation in vertical text. (175064567)
Fixed SVG intrinsic aspect ratio being incorrectly suppressed when preserveAspectRatio is set to none. (175173375)
Fixed SVG images without complete intrinsic dimensions incorrectly using ratio-based scaling for background-size. (175345107)
Fixed the SMIL clock value parser to accept hours greater than 99 and reject malformed seconds values. (175593583)
Fixed stroke-dasharray interpolation to use least common multiple for list length matching and corrected composition behavior. (175598175)
Fixed an issue where @prefers-color-scheme in an SVG image will sometimes not follow the system color preference. (176413340)
WKWebView
Safari 27 brings a significant expansion of WKWebView public API for native app developers. The additions make it easier to build advanced browser and web-hosting experiences on top of WebKit:
WKSerializedNode — clone DOM nodes, including shadow roots, between different WKWebView instances.
WKJSHandle — use JavaScript object references from native code.
WKContentWorldConfiguration — configure content world properties such as autofill scripting, shadow root access, and inspectability when creating a WKContentWorld.
alternateRequest and overrideReferrerForAllRequests on WKWebpagePreferences — modify the main resource request during navigation and apply custom referrer headers across all resource loads.
willSubmitForm callback on WKNavigationDelegate — receive notification of HTML form submissions via a new WKFormInfo object.
mainFrameNavigation on WKNavigationAction and mainFrameNavigation on WKNavigationResponse — correlate navigation actions and responses with each other and their originating loads.
WKWebView.load(url:) — load a URL directly without wrapping it in an NSURLRequest.
WKHTTPCookieStore.cookies(for:) — retrieve cookies matching a specific URL without fetching the entire cookie store.
Web Inspector
Several Web Inspector updates in Safari 27 beta make common debugging tasks easier.
The Color Picker now shows color contrast information inline as you edit — no more switching tools mid-decision to check whether a color combination is accessible. This works when you’re editing both foreground and background colors at the same time.
The Color Picker’s format and gamut controls are also now visible upfront instead of hidden. If you’ve ever gone hunting for those options, this will help.
In the Network tab, when a resource redirects, you can now see every request in the chain rather than just the final destination. It’s much easier to figure out what’s actually happening.
The Elements tab adds Subgrid and Grid-Lanes badges that make it easy to identify subgrid and grid-lanes layout contexts as you explore a page.
The Timeline tab now includes the layout root element in Layout event details, so you can see which element triggered a layout pass.
Additional bug fixes:
Fixed an issue where CSS properties added to new rules were not applied and were marked as invalid. (103548968)
Fixed an issue in the Network panel where the Request / Response menu did not remember the user’s previously selected value. (108231795)
Fixed editing inline style attribute values in the Elements panel resulting in truncated or malformed content. (149523483)
Fixed an issue where the input field for recording canvas frames in the Graphics tab was sometimes too small to type in and only allowed typing one character at a time. (157787230)
Fixed the Network tab filtering by resource type not working after clearing a filter that had no matches. (161570940)
Fixed an issue where CSS rules added via the “Add New Rule” button in the Styles panel were intermittently not applied or would vanish after entering a property. (164971557)
Fixed an issue where tree outlines in Web Inspector would intermittently show blank content while scrolling when a filter was active. (169502061)
Fixed an issue where an active recording in the Timelines tab would stop when navigating or reloading the current page even when the setting to stop recording once the page loads was turned off. (169732727)
Fixed an issue in the Timelines tab where rows containing object previews were sometimes not visible in the heap snapshot data grid. (170164522)
Fixed context menu items in the Elements tab to only display relevant options when multiple DOM nodes are selected. (170307979)
Fixed an issue where previewing resources in the Network tab displayed an error upon navigating away and Preserve Log was enabled. (171216835)
Fixed an issue where selected DOM node keys in a Map in the Scope Chain sidebar had unreadable white text on a light background. (171840122)
Fixed an issue where the WebAssembly debugger had no source bytes for modules compiled via WebAssembly.instantiateStreaming, preventing source-level debugging in LLDB. (174362152)
Fixed the WebAssembly debugger to generate human-readable module names from the WebAssembly name section and fetch URL, replacing bare address-based fallback names in LLDB’s image list. (174465437)
Fixed the Safari Develop menu and WebDriver to launch Device Hub instead of Simulator when available in Xcode. (174276041)
Fixed the Layers 3D view to correctly map textures to composited bounds and use proper selection highlighting instead of tinting textures. (174355052)
Fixed the Layers 3D view to re-snapshot preserved layers after a repaint instead of displaying stale textures. (174358757)
Fixed an issue where all folder tree elements were expanded after filtering for a resource in the Sources panel. (175009135)
Fixed an erroneous “There are unread messages that have been filtered” banner appearing in the Console when console.groupCollapsed() is used. (175279759)
Fixed an issue in the Storage tab where filtering by storage type did not reveal the popup with options. (175444192)
Fixed Web Inspector toolbar buttons rendering at incorrect sizes. (176508343)
Accessibility
Fixed an issue where calling speechSynthesis.cancel() removed utterances queued by subsequent speechSynthesis.speak() calls. (46151521)
Fixed an issue where SVG <use> elements referencing <symbol> elements inside an <img> were incorrectly included as unnamed images in VoiceOver’s Images rotor. (98999595)
Fixed an issue where changing the id attribute of an element targeted by aria-owns did not update the accessibility tree. (107644248)
Fixed slot elements referenced by aria-labelledby to correctly use their assigned slotted content for accessible names and ignore hidden slotted nodes. (114500560)
Fixed <meter> element to have consistent labels between aria-label and title attributes. (127460695)
Fixed elements with display: contents and content in a shadow root to have their content properly read when referenced by aria-labelledby. (129361833)
Fixed aria-labelledby to use the checkbox name instead of its value when the checkbox name comes from an associated <label> element. (141564913)
Fixed VoiceOver cursor positioning for elements focused via the drawFocusIfNeeded() canvas API. (146323788)
Fixed grid elements with child rows in a shadow root to properly work with VoiceOver. (153134654)
Fixed an issue where VoiceOver read text within images that have role="presentation". (159304061)
Fixed an issue where content within dynamically expanded <details> elements was not exposed in the accessibility tree. (159865815)
Fixed an issue where the contextmenu event was not fired for elements inside iframes when triggered by keyboard or assistive technology actions such as VoiceOver’s VO+Shift+M. (164128676)
Fixed an issue where changes to <input type="button"> elements inside live regions were not announced by assistive technologies. (168200460)
Fixed ::first-letter text not being exposed in the accessibility tree when no other text accompanies it. (168458291)
Fixed an issue where VoiceOver was unable to access aria-owned rows and their cells in grids and tables. (168770938)
Fixed an issue where VoiceOver could not find focusable splitter elements when navigating to the next or previous form control. (170187464)
Fixed an issue where color picker inputs could not be activated using VoiceOver’s press action. (172218114)
Fixed an issue where interactive elements containing an <svg> named by a child <title> element did not expose an accessible name. (172559238)
Fixed an issue where incorrect bounding boxes were computed for MathML table rows and cells. (172851295)
Fixed an issue where comboboxes did not forward focus to their aria-activedescendant, preventing assistive technologies from interacting with list items. (172931277)
Fixed an issue where aria-owns was not respected when computing the accessible name from element content. (173249317)
Fixed VoiceOver line-by-line reading skipping content in read-only documents. (174349841)
Fixed invalidation of aria-hidden=”true” when focus lands inside the aria-hidden subtree. (174449524)
Forms
Fixed an issue where keyboard commands such as paste did not work in form fields that restrict input to numbers. (4360235)
Fixed an issue where keyboard tabbing position was lost when a focused button became disabled, causing focus to jump to the beginning of the page. (120676409)
Fixed an issue where small range input slider thumbs were difficult to interact with on iPadOS and visionOS by expanding their touch hit area. (147428926)
Fixed <datalist> suggestions appearing with with white text on a white background in dark mode after typing. (168676757)
Fixed an issue on iOS where typing into an <input> element associated with a <datalist> was intercepted by type-to-select behavior. (173346270)
Fixed: Made the <input type="checkbox" switch> control behave more like other controls with regards to native appearance CSS properties. (173487610)
Fixed an issue where date and time input types without min or max attributes incorrectly matched the :in-range pseudo-class. (174829899)
Fixed an issue where cloned <input> and <textarea> elements did not preserve their user-modified state. (174892989)
Fixed field-sizing: content clipping the placeholder on number inputs that have no value. (175883299)
Printing
Fixed an issue where animations were ignored during print, causing missing content on animated pages. (36901701)
Fixed an issue where printing light text on a dark background with backgrounds disabled could result in invisible text. (170070133)
Fixed a regression where printing a WebView embedded in an enclosing NSPrintOperation dropped all text. (174756900)
To try Safari 27 beta, install the developer beta on your Apple device. You can also install Safari Technology Preview for macOS 27 beta and macOS 26.
Feedback
We love hearing from you. To share your thoughts, find our web evangelists online: Jen Simmons on Bluesky / Mastodon, Saron Yitbarek on BlueSky, and Jon Davis on Bluesky / Mastodon. You can follow WebKit on LinkedIn. If you run into any issues, we welcome your feedback on Safari UI (learn more about filing Feedback), or your WebKit bug report about web technologies or Web Inspector. If you run into a website that isn’t working as expected, please file a report at webcompat.com. Filing issues really does make a difference.
Update on what happened in WebKit in the week from May 19 to June 1.
The main feature of this week are new releases: stable ones with many security
fixes, and development ones with the new Skia-based compositor enabled. Additionally,
there was work on Web-facing features, optimizations, spell checking support for
the WPE port, and more.
Cross-Port 🐱
WebKit now supports mirroring
MathML stretchy operators using the OpenType rtlm feature.
Replaced the CloseWatcherManager's
escapeKeyHandler, which will allow other types of close signals to be supported.
Implemented queuing mutation observer
records in the work-in-progress moveBefore() implementation.
Implemented popover integration with
close watcher.
Fixed popover light dismiss to
account for popovertarget on input buttons.
Content filters now create temporary files in the compiled filters
directory, which ensures that a file
rename can always be used to place them at their final location. This avoids
falling back to a regular file copy, which can be slower, when the temporary
directory returned by g_get_tmp_dir() (typically /tmp) is in a different
volume than the filters' storage path configured for
WebKitUserContentFilterStore.
WPE WebKit 📟
Enabled spell checking support in
WPE. The existing implementation for
the WebKitGTK port, which uses the
Enchant library as a backend, was
generalized to provide spell checking support in WPE as well. The feature may
be toggled at build time using the ENABLE_SPELLCHECK CMake option.
Releases 📦️
WebKitGTK
2.52.4 and
WPE WebKit 2.52.4 have
been released; they include a number of fixes for security issues, and it is a
highly recommended update. The corresponding security advisory, WSA-2026-0003
(GTK,
WPE is available as well.
The release also includes a number of small improvements and Web compatibility
fixes.
Additionally, development releases WebKitGTK
2.53.3 and
WPE WebKit 2.53.3 are
available since last week. These include a change to use a new Skia-based
compositor by default, which is intended to replace TextureMapper once ready.
Therefore, bug reports related to website rendering
are particularly welcome when using this and subsequent development releases.
Infrastructure 🏗️
The deprecated and un-maintained Flatpak-based SDK was
removed. Developers working on
the WPE and GTK WebKit ports are encouraged to migrate to the new
SDK.
Depending on the web application, the WPE WebKit memory usage trend can vary. When simple web applications are being processed, the memory consumption tends to be virtually stable (the same) no matter the period. However, when more complicated web applications
are being executed, the memory usage usually grows over time while going back to normal from time to time e.g., when GC / memory pressure mechanism releases all kinds of caches and not-needed memory. Therefore, memory growth itself is not unusual.
Nevertheless, as the memory leaks happen in WPE at times, the memory growth is worth investigating — especially if very rapid or unbounded.
This article presents a structured playbook for investigating such a memory growth and memory leaks in WPE. Rather than diving straight into debugging tools, it starts from first principles: confirming the problem is real, choosing the right
environment to work in, and narrowing down the leaking area before any heavy tooling is involved. The goal is to reach actual debugging as fast as possible, regardless of whether the environment is an embedded device or a desktop machine,
and regardless of how quickly the problem reproduces.
The high-level list of recommended steps to follow is presented below. In a nutshell, the steps 1, 2, and 3 are meant to choose and follow the fastest possible investigation path so that actual debugging of the problem
(step 4) can be started as soon as possible.
The ultimate first step when working with alleged memory leak is to check whether the observed memory growth is actually abnormal. In the case of web browsers in general, the memory growth alone may not necessarily mean something is leaking.
There may be many regular reasons why the browser’s memory usage is growing, but the usual suspects are:
JavaScript-level memory allocations — due to the very nature of JavaScript, the memory it allocates causes the overall web content process memory growth up until the garbage collector (GC) kicks in. Then (from the RSS perspective) some memory
is usually freed. However, as it’s not easy to predict when the GC will be invoked (e.g., when the browser processes an application that performs heavy rendering), it’s possible that memory will grow but remain garbage-collectible.
JavaScript Just-in-Time (JIT) compilation — when not explicitly disabled or limited, the processing of any web application that has JavaScript code associated with it will cause the browser to continuously compile the JavaScript code in the
background so that it executes such code faster in runtime at the expense of memory that is required for storing compiled artifacts.
Caches — as the WPE operates, it caches things such as web resources, style resolution artifacts, textures, glyph atlases, layer tiles, display lists, rasterization artifacts, and many others. Naturally, the cache sizes are limited, however,
if many caches are growing at the same time, they may create an impression of a leak. The difference in that case is, the caches stop growing at some point.
Due to the above, to confirm the memory growth is abnormal, one should usually try the following first:
Triggering memory pressure to force the browser to trigger GC and evict as many cache entries as possible,
If the memory growth doesn’t stop with JIT disabled or its level does not go back to normal after triggering memory pressure, the growth can be assumed to be abnormal, and one can proceed to the next step.
2. Identifying the best setup for reproducing the problem #
When the memory growth is atypical, it needs to be narrowed down in a way that the final debugging is possible. For both narrowing down and the debugging, one should aim at the most flexible development environment along with the smallest possible
web application that reproduces the problem quickly. What it means in practice is — desktop environment along with small demo web application that reproduces the problem. Whilst it’s not always possible to have such an environment, the 3 general
rules are as follows:
Desktop environment is usually better than embedded one in terms of working with memory leaks as it offers minimal overhead (e.g., in terms of compilation times) and huge flexibility in choosing the industry standard tools for profiling/debugging.
Small web application is always better than a big one as long as it still reproduces the same problem in the same amount of time. In such case, a small application minimizes the amount of noise that usually stands in the way of profiling/debugging.
A web application that reproduces the problem quickly is always better than the one that needs much more time for it. The worst thing that can happen in the case of narrowing down memory leaks, is when the memory growth is noticeable or starts
after a very long time such as hours/days+.
Given the above, at this point one should go through the below steps:
Check if the setup is trivial enough already — if the web application reproduces the problem quickly in a desktop environment and is simple enough, one should immediately jump to the Debugging section.
Check if the problem can be reproduced on desktop assuming it originally reproduces on embedded.
Check if the problem can be reproduced faster if it’s not reproducing fast enough.
Check if the web application could be simplified.
Once the setup is simplified as much as possible, one should proceed to one of narrowing down sections depending on the setup. Also, if the setup is still not ideal, one should actively seek opportunities for simplifying the setup
even during narrowing down as it’s likely that some new information will eventually open new possibilities in terms of simplifying setup.
When the problem has been confirmed but there are not enough clues to tell exactly which parts leak, the debugging cannot be started right away. In such case, it’s necessary to narrow down the problem to the browser/application area
that can be easily debugged.
While in some cases narrowing down is not even necessary, quite often it takes orders of magnitude more time than actual debugging, and hence one should pay special attention to this step.
3a. Narrowing down on embedded when the problem takes a long time to reproduce #
This is the toughest situation one can find themselves in. When a problem takes a long time to reproduce (hours/days+), every iteration/test comes automatically with a significant cost. Moreover, when the environment is an embedded one,
rebuilding WPE is usually more time-consuming and the amount of tooling is usually limited — or requires some work to bring it to the image at least.
Due to the above, narrowing down the problem in this setup requires a structured approach with extra care. In such case, the things to check should be approached in steps defined as follows:
in case of embedded devices, extra care is needed when attaching a memory profiler. On low-end devices, memory profilers tend to slow down the application hard enough to trigger otherwise non-existent problems.
in case of embedded devices, one should prefer limiting JIT over disabling it as without it, the JS execution may be slow enough to trigger unexpected scenarios.
Ideally, while checking various things along the above steps, one should batch as many checks as possible within individual tests.
3b. Narrowing down on embedded when the problem reproduces quickly #
When the problem reproduces quickly, the limitations of embedded environment are not that relevant. In this scenario, one should prioritize getting debug symbols (RelWithDebInfo build) into the image and utilizing them by running
the browser with whatever profilers are available. For the specific things to check, one should seek inspiration in the following groups:
However, this time, there are some extra opportunities around tooling:
There should be many more tools available already in the system or available to be installed.
Tools such as memory profilers that could slow down the application making it unusable on embedded, may turn out to be working well when the desktop-class processing power is available.
With the above in mind, it’s worth trying all the tools available with priority because if at least one tool works well, one can save hours of narrowing down.
3d. Narrowing down on desktop when the problem reproduces quickly #
This is technically the simplest possible scenario, so basically, all the possibilities are available. The most time-consuming activity in this case is very likely rebuilding WebKit itself — although it should still be relatively fast.
In such case, just after a few quick checks with the Web Inspector, it’s recommended to get debug symbols (RelWithDebInfo build) and start with tools such as memory profilers.
Other than the above, one should go through the following groups on things to check:
Debugging WPE WebKit is the same as debugging any other C/C++ application on Linux (or Mac if the issue is cross-port and one prefers an Apple port to work with), and hence is outside the scope of this article. Some WebKit-specific information
can be found in the WebKit Documentation article on building and debugging page and therefore is recommended as a first step.
When the problem lies in JavaScript code, the situation is usually fairly straightforward. The majority of bugs in this area should be reproducible across various browser engines and hence a full variety of tooling should be available.
If the WebKit is preferred or if the problem reproduces only there, the tooling available is still very useful and helps debugging problems quickly. The ultimate tool in such case is the
Web Inspector. On official WebKit’s web page there’s entire index of articles on Web Inspector. Among those, the most interesting
read is about Timelines Tab where the most useful debugging can be done. Once the features of Timelines Tab are understood, the next important article is
the memory debugging guide. It dives into the most important Timelines Tab subsections and showcases the work with heap snapshots which is a key. To supplement it,
it’s very important to know the heap snapshot delta feature which is basically about button:
that allows one to inspect the delta-snapshot between 2 snapshots. It’s critical as it answers the question on what JS objects were added between the base snapshot and the later one. If some objects are piling up, it immediately shows
which ones.
One important note on snapshots is that in some cases when using Web Inspector is not possible, one can generate the snapshots manually from the web engine’s C++ code by just calling GarbageCollectionController::singleton().dumpHeap(); at
some appropriate moment. In this case, the dump will be written to standard output. It can be then turned into a file and imported from any Web Inspector using Import button.
As the Timelines Tab with its subsections should be able to answer on what happens, to understand why it actually happens, the last missing piece is the JS debugger within Web Inspector. It’s not very different to debuggers in
other engines, but it’s worth checking a dedicated article on it just to understand the capabilities.
Even if the WPE is running with default settings in release mode, there are plenty of useful things that can be checked while the browser is still running:
Identifying which WebKit process allocates abnormally,
there are multiple ways to do this, but usually it’s as easy as using ps utility.
Identifying how fast the process in question allocates the memory,
this is useful to know at least for comparison purposes, but it may hint some problems already if the numbers correlate with what web application does.
Checking logs from stdout, stderr, and journal (using journalctl).
in short, memory pressure triggers the cleanup of the majority of caches along with GC. Therefore, if this is able to bring memory back to normal level, then the problem is about caches, JS Heap / GC, or fragmentation.
even if the debug symbols are not present, this may be useful to see what data is being captured and how the web application behaves when slowed down by profiler.
even if the debug symbols are not present, various tools offer different perspectives on what the browser is doing. In some cases, such information may reveal some anomalies that may be related to the main issue.
Cross-checking with other browsers,
if other browsers show a similar pattern of memory usage, it’s very likely the problem lies in web application itself. Otherwise, it strongly suggests a bug in the WPE.
Cross-checking with other ports,
if any other WebKit port shows a similar pattern of memory usage, it allows one to narrow down the area in the code a bit based on what port it is:
if the same behavior is visible in any of Apple ports, the problem is most likely related to cross-platform code,
if the same behavior is visible only in GTK port, then the problem is most likely related to GLib-related part, coordinated graphics part, GStreamer-related part, or others that are shared.
while generic logs may hint some unusual behavior, more specific ones such as GC logs (JSC_logGC=1) may be used to check how the individual JS heap sizes evolve over time and how GC behaves. If it’s JavaScript
leaking the memory, this log will quickly provide the evidence.
both breakdown and trend of memory usage in the memory timeline after doing a bit of recording,
the effects of takeHeapSnapshot() invoked from JS console:
as this function usually triggers GC internally, it may be used to check how much RSS memory is reclaimed by GC in isolation (followed up by scavenger),
as this function takes a JS heap snapshot, it then can be used to explore manually if its contents point towards something interesting.
there are at least a few places (levels) where JIT compilation engine allocates memory. If limiting doesn’t resolve the issue completely, it’s likely the engine itself leaks some memory around temporary helper-heaps such as AssemblerData etc.
some environment variables and runtime preferences change the behavior of the web engine significantly. If changing one of them makes the problem go away, it usually helps to narrow down the problematic area quickly.
Running WPE with system malloc (environment variable Malloc=1) and checking the memory usage,
when one suspects bmalloc/libpas issues with fragmentation or scavenger, it’s worth running a browser with system malloc to compare the memory evolution over time against the bmalloc/libpas.
if triggering memory pressure is not possible, an alternative solution is to limit the device memory so that the browser is under constant memory pressure.
stack traces — to see what parts of engine are particularly active as it may hint some problematic area,
WebKit marks — to see what the engine is doing as well as quantitative data in marks such as EventLoopRun etc. as in those cases the numeric value trends may reveal resource pile up.
as WPE allows switching to system malloc as an allocator, it’s possible to use custom malloc implementation with instrumentation such as gperftools. For that, the recommended read is
this article from fellow Igalian, Pablo Saavedra.
the data produced by memory sampler is roughly the same as inspector’s memory timeline, however, it’s much more convenient as it doesn’t need web inspector at all.
when memory growth seems to be related to DOM mutations, it’s worth enabling and reporting node statistics periodically — in some cases, it may directly suggest what the problem is about.
Building and running with malloc heap breakdown,
when all other means fail, a very good last-resort approach for investigating memory usage statistics via a debug-only WebKit feature called Malloc Heap Breakdown. The details can be found in
the dedicated article about it.
On very rare occasions such as memory fragmentation or allocation issues, it may be worth checking the libpas (low-level memory allocation and management library)
statistics as WPE uses it by default on the vast majority of platforms.
As WPE WebKit uses multi-process architecture, there are multiple processes that can be checked, although the most interesting one is usually the Web Content Process. Once the PID of the given process is determined (e.g., using ps utility)
the usual steps to check detailed memory statistics are:
cat /proc/<PID>/status or cat /proc/<PID>/statm for very basic statistics,
pmap -X <PID> - for detailed statistics (if available),
cat /proc/<PID>/smaps_rollup and cat /proc/<PID>/smaps for detailed statistics (requires CONFIG_PROC_PAGE_MONITOR kernel configuration option).
WPE uses a so-called Memory Pressure Monitor to observe the memory usage in the system and to react if there’s not much memory left. The default thresholds are specified in MemoryPressureMonitor.cpp and usually are
90% for non-critical and 95% for critical response. Depending on the response, WPE schedules GC and clears internal caches immediately.
As the above is usually on by default, one can leverage it to trigger GC (along with cache cleanups) by filling up the available memory in the OS to 95+%. There are many ways to allocate memory, yet the simplest is using stress:
e.g. stress --vm 1 --vm-bytes 1024M --vm-keep to allocate 1024 MB.
When attaching any memory profiler, unless one wants to profile only native allocations (Skia, GStreamer, ICU, etc.), the key is to use Malloc=1 environment variable on WPE startup so that bmalloc uses system malloc instead of libpas.
Then the commands are as follows:
to attach heaptrack:
heaptrack -p <PID> so e.g. heaptrack -p $(pgrep WPEWebProcess) (see this article for details),
to run with valgrind’s massif (as attaching to running process is not possible):
valgrind --tool=massif --trace-children=yes <WPE-BROWSER-COMMAND> (see this article for details).
If memory profilers are unusable or unavailable, it’s worth checking if other tools are present and experimenting a bit with them if so. In some cases, tools other than memory profilers may give some hints on further investigation
or reveal a suspicious pattern within application execution. Some ideas for experiments with various tools are listed below:
strace:
strace -c -p $(pgrep WPEWebProcess) — strace called with -c gives a nice summary of system calls executed by the traced application. It can be useful to check the overall syscall usage pattern to see if there are any anomalies.
strace -p $(pgrep WPEWebProcess) -e trace=mmap,munmap,mremap,madvise -tt — strace focused on mmap()-related system calls may be useful to debug libpas.
perf:
perf record -F 999 -ag -p $(pgrep WPEWebProcess) -- sleep 60 — regular recording with perf can be very useful, especially if symbols are available. With that, one can generate
flamegraphs and investigate what’s going on in the browser. While it’s not about profiling memory, it may be helpful to narrow down at least a bit.
perf record -F 999 -e syscalls:sys_enter_mmap,syscalls:sys_enter_munmap,syscalls:sys_enter_mremap:sys_enter_madvise -ag -p $(pgrep WPEWebProcess) -- sleep 60 — perf focused on mmap()-related system calls is much more superior
than e.g. strace as it also records stack traces. Therefore, if debug symbols are present, and if the memory growth is very rapid, it’s very likely the libpas mmap() stacktraces will lead to the growth origin statistically.
perf trace -e mmap,munmap,mremap,madvise -p $(pgrep WPEWebProcess) — this is very much similar to strace focused on mmap()-related system calls as it shows a live preview of what’s happening.
sysprof:
sysprof-cli -f — while running system-wide sysprof won’t make WPE push marks into it, the profiling trace may still be useful to some degree, especially if debug symbols are available.
Limiting JIT can be achieved via environment variables:
JSC_jitMemoryReservationSize=<BYTES> to limit JIT memory usage (the limit is semi-strict as some JIT compilation engine buffers are limited by this value indirectly),
JSC_useFTLJIT=false to disable FTL tier,
JSC_useDFGJIT=false to disable DFG and FTL tiers,
JSC_useBaselineJIT=false to disable Baseline, DFG, and FTL tiers.
WPE is a fairly complex piece of software and hence it offers various logging capabilities related to WebKit itself, as well as to related libraries. The vast majority of logging can be controlled via environment variables:
WEBKIT_DEBUG=all to enable all logging channels,
WEBKIT_DEBUG=Layout,Media=debug,Events=debug to enable selected logging channels,
JSC_logGC=2 to enable JS garbage collector logs,
GST_DEBUG=4 to enable gstreamer (multimedia-related) logs (see the documentation),
G_MESSAGES_DEBUG=all to enable GLib-level logs.
If MiniBrowser (or similar browser) is used, one can also set a runtime preference to enable JS console.log(...) logging to the standard output:
Enabling WPE’s remote web inspector is a twofold process:
The first step is to run WPE with the proper environment variable so that it starts listening on IP:PORT using tcp socket:
WEBKIT_INSPECTOR_SERVER=IP:PORT is the most reasonable option as it uses inspector:// protocol that can be utilized by WebKit-native browsers such as GNOME Web (Epiphany) or Safari,
WEBKIT_INSPECTOR_HTTP_SERVER=IP:PORT is a less preferable alternative that uses HTTP protocol and technically works from any browser. However, no seamless integration is guaranteed in this case.
The second step is to connect from a regular web browser to the WPE:
using inspector://IP:PORT/ if native inspector server was started,
using http://IP:PORT/ if HTTP inspector server was started,
forwarding the ports using socat tcp-l:PORT,fork,reuseaddr tcp:IP:PORT if the WPE is running in unreachable network.
Experimenting with environment variables and runtime preferences #
The most outstanding environment variables changing the behavior of WPE are the following:
WPE_DISPLAY — assuming the new WPE platform API is used, this environment variable allows one to switch the pre-defined platform implementation thus
changing a platform-facing part of graphics pipeline. The valid options are:
WPE_DISPLAY=wpe-display-headless — for headless implementation,
WPE_DISPLAY=wpe-display-drm — for direct rendering manager integration,
WPE_DISPLAY=wpe-display-wayland — for wayland integration,
WEBKIT_SKIA_ENABLE_CPU_RENDERING — when set to 1, rendering the DOM contents to the layers is done using Skia CPU backend instead of GPU one.
The most outstanding runtime preferences changing the behavior of WPE are the following:
CanvasUsesAcceleratedDrawing — when disabled, 2D canvas will use Skia CPU backend instead of GPU one,
LayerBasedSVGEngine — when enabled, WPE uses a different SVG engine internally,
AcceleratedCompositing — when disabled, WPE uses experimental, non-composited mode that bypasses all of the compositor work.
On desktop, the simplest way to get release with debug symbols is to utilize CMake’s build type by using -DCMAKE_BUILD_TYPE=RelWithDebInfo within WPE build command, so:
and potentially INHIBIT_PACKAGE_STRIP to control whether debug symbols should be kept with the binary or not. This may be necessary occasionally as some tools have problems reading .gnu_debuglink and therefore work only
with symbols included in the binaries.
WebKit works pretty well with all kinds of sanitizers. To build with any of them a CMake-level helper called ENABLE_SANITIZERS can be used by specifying -DENABLE_SANITIZERS=address, -DENABLE_SANITIZERS=leak etc. With that, the command for
building e.g. on desktop could look like:
Libpas statistics are a debug-only feature that can be enabled by changing 0 of #define PAS_ENABLE_STATS 0 to 1 in Source/bmalloc/libpas/src/libpas/pas_config.h and then running WPE with environment variable PAS_STATS_ENABLE=1.
Safari Technology Preview Release 244 is now available for download for macOS Tahoe and macOS Sequoia. If you already have Safari Technology Preview installed, you can update it in System Settings under General → Software Update.
Fixed VoiceOver cursor positioning for elements focused via the drawFocusIfNeeded() canvas API. (312024@main) (146323788)
Fixed an issue where interactive elements containing an <svg> named by a child <title> element did not expose an accessible name. (312953@main) (172559238)
Added the animation property to AnimationEvent and TransitionEvent interfaces. (312859@main) (176527591)
Resolved Issues
Fixed CSS anchor-positioned elements not updating correctly when their anchors have their transform animated. (312752@main) (175896047)
CSS
New Features
Added support for the normal and none values on the position-anchor CSS property. (312378@main) (172097721)
Added support for transform-aware anchor positioning. (312317@main) (175401339)
Resolved Issues
Fixed an issue where -webkit-text-fill-color incorrectly overrode text-decoration-color. (312789@main) (47010945)
Fixed shape-outside computing incorrect text wrapping in RTL writing modes. (312516@main) (56890238)
Fixed CSS zoom interacting incorrectly with font-weight, font-style, and font-variant on iPad. (312944@main) (152173269)
Fixed FontFace.loaded to reject when a local() font source fails to load. (312933@main) (174631384)
Fixed CSS trigonometric functions to correctly convert degrees to radians. (312860@main) (175575617)
Fixed sibling-index() and sibling-count() inside calc() functions to be correctly simplified. (312026@main) (175590806)
Fixed sibling-index() and sibling-count()to correctly return 0 when used in cross-tree ::part() styling. (312544@main) (175592607)
Fixed the CSS resize handle not working on an element when the handle overlaps a child iframe. (312099@main) (175621855)
Fixed flex container baseline alignment being incorrectly computed for scroll containers by clamping to the border edge. (312206@main) (175631095)
Fixed an issue where inline-level boxes with calc() margins or padding lost the fixed component during intrinsic width computation. (312081@main) (175669222)
Fixed floats with margin-start incorrectly overlapping adjacent floats. (312083@main) (175669464)
Fixed aspect-ratio calculations for block-level elements with size constraints. (312084@main) (175669713)
Fixed aspect-ratio calculations for flex items with percentage cross-size constraints. (312085@main) (175669774)
Fixed an issue where block-size: stretch resolved incorrectly for absolutely positioned elements with orthogonal writing modes. (312086@main) (175669844)
Fixed aspect-ratio calculations for flex items with definite cross-size values. (312108@main) (175690028)
Fixed revert-layer computing incorrectly when there is a leading empty or space substitution value. (312721@main) (175729680)
Fixed an issue where absolutely positioned tables with content exceeding their declared CSS width were incorrectly positioned. (312197@main) (175755871)
Fixed height calculations for absolutely positioned tables with percentage-sized children. (312204@main) (175762381)
Fixed an issue where absolutely positioned tables with explicit percentage or fixed heights did not resolve correctly against their containing block. (312280@main) (175852400)
Fixed absolutely positioned tables ignoring min-height and shrinking below their content height. (312313@main) (175883577)
Fixed an issue where a flex item with aspect-ratio and content-box padding computed the wrong height in a column flex container. (312441@main) (176033726)
Fixed an issue where flex items with explicit min-height: min-content were incorrectly treated as scrollable, zeroing out their minimum size. (312517@main) (176173688)
Fixed :has() invalidation performance when used inside nested :is() selectors. (312715@main) (176354723)
Fixed sibling-count() & sibling-index() used in @keyframes to re-resolve when siblings change. (312895@main) (176531901)
Forms
Resolved Issues
Fixed <datalist> suggestions appearing with a white background on white text in dark mode after typing. (312889@main) (168676757)
Fixed the select picker appearing at an incorrect position when the <select> element is anchor positioned. (312811@main) (175454476)
Fixed field-sizing: content clipping the placeholder on number inputs that have no value. (312936@main) (175883299)
Fixed <option> and <optgroup> elements to match the :disabled pseudo-class when inside a disabled <select>. (312890@main) (176559708)
HTML
New Features
Added support for tabindex, focus(), blur(), and autofocus on MathML elements per the HTML Standard. (312609@main) (176258900)
Resolved Issues
Fixed history.pushState() and history.replaceState() URL rewriting to match the updated specification. (312738@main) (83203469)
Fixed sequential focus navigation to skip elements that do not meet the specification’s focusability requirements. (312032@main) (103370883)
Fixed innerText to no longer emit newlines for visibility: hidden block elements. (312010@main) (175569426)
Fixed innerText to correctly emit blank lines around <p> elements regardless of their CSS display value. (312169@main) (175729427)
Fixed the speculative preload scanner to no longer incorrectly preload scripts inside SVG elements. (312327@main) (175800116)
Fixed innerText on tables to no longer emit spurious trailing newlines and to preserve row-exit newlines after empty rows. (312941@main) (176635985)
Images
Resolved Issues
Fixed naturalWidth and naturalHeight returning incorrect values for SVG images without intrinsic dimensions. (312552@main) (141196049)
Fixed an issue where HDR images would flicker and lose their HDR appearance when overlapping layers animate. (312702@main) (163382580)
JavaScript
Resolved Issues
Fixed an issue where parse errors in workers were not reported to the parent. (312701@main) (175610725)
Fixed a performance issue with module resolution by limiting cache population to star-resolution and indirect-resolution cases. (312416@main) (175826413)
Fixed a performance issue with TypedArray.prototype.lastIndexOf by adding SIMD-accelerated reverse search for numeric types. (312383@main) (175904377)
Fixed a performance issue where building a module namespace with many export * statements was significantly slower than necessary. (312370@main) (175949532)
Fixed DataView constructor to match specification-defined argument validation order and error throwing behavior. (312483@main) (176110210)
Fixed an issue where Array.prototype.concat could produce incorrect results when combining arrays with incompatible indexing types. (312560@main) (176219964)
MathML
New Features
Added support for multiple-character operators in MathML. (312867@main) (170907545)
Resolved Issues
Fixed padding and border rendering on <msqrt> and <mroot> elements and corrected token sizing for mathvariant. (312902@main) (173081436)
Fixed absolute positioning of elements inside MathML by ensuring logical height is updated. (312905@main) (173088146)
Fixed tabIndex values not being set correctly for MathML elements. (312681@main) (174734133)
Media
New Features
Added support for synchronized video playback on displays using genlock on macOS. (311815@main, 312166@main) (175197574)
Resolved Issues
Fixed video playback failing when the declared MIME type in a <source> element does not match the actual content type served by the server. (312399@main) (166181001)
Fixed ImageCapture to correctly queue takePhoto() and applyConstraints() requests to avoid concurrent capture session reconfiguration. (312196@main) (174950018)
Fixed ::cue() selectors to correctly match the WebVTT root object in addition to child nodes. (312292@main) (175550173)
Fixed Media Source Extensions readyState not being updated immediately when playback stalls due to a gap in buffered data. (312694@main) (176330683)
Networking
Resolved Issues
Fixed XMLHttpRequest incorrectly dropping the request body during redirects. (312092@main) (98459882)
Fixed an issue where partitioned cookies could not be deleted via WKHTTPCookieStore. (312478@main) (174557252)
Rendering
New Features
Added support for anchor-valid and anchor-visible as aliases of anchors-valid and anchors-visible in position-visibility. (312080@main) (174438361)
Added support for the Dutch IJ digraph in text-transform: capitalize and ::first-letter, correctly titlecasing “ij” to “IJ” at word starts when the content language is Dutch. (312335@main) (175912959)
Resolved Issues
Fixed an issue where a block formatting context with margin-start could overlap an adjacent float. (312082@main) (93187697)
Fixed boxes in the top layer to use the initial containing block as their static-position rectangle. (312908@main) (155495104)
Fixed an issue where form controls with height: 100% in auto-height containers incorrectly resolved to zero height. (312526@main) (161699543)
Fixed text being incorrectly truncated in RTL containers when combined with text-overflow: ellipsis and an inline-block pseudo-element. (312799@main) (168875614)
Fixed an issue where height: 100% was incorrectly calculated for replaced elements like images serving as grid items nested inside a flexbox. (312281@main) (169431440)
Fixed an issue where if a document in an iframe uses @prefers-color-scheme, it does not follow the color-scheme set by grandparents of the iframe. (312212@main) (172229372)
Fixed an issue where list markers rendered on the wrong line when list items started with empty inline elements. (312356@main) (172762578)
Fixed an issue where a child element with filter: blur() ignored border-radius overflow clipping from its parent. (312531@main) (175519148)
Fixed incorrect event type mappings where mousemove and mouseup event listener region types were reversed. (312142@main) (175651369)
Fixed an issue where containers with block-in-inline content did not expand when max-height was removed. (312608@main) (175799547)
Fixed always-on scrollbar thumbs not rendering on the root element of nested documents with display: flex. (312300@main) (175866046)
Fixed scrollbar-gutter placement on the root element in RTL layouts. (312360@main) (175939512)
Fixed an issue where numbered list item markers rendered with more spacing between the marker and list content than in other browsers. (312515@main) (176027025)
Fixed an issue where block-level boxes nested within inline elements were not properly aligned when using align-content: center. (312514@main) (176173122)
Fixed a regression where height: stretch on children of flex items incorrectly resolved to viewport height instead of behaving as auto when the flex container lacked an explicit height. (312916@main) (176288044)
Fixed intrinsic sizing for non-replaced elements with percentage dimensions. (312828@main) (176493856)
SVG
Resolved Issues
Fixed SMIL repeat(n) event conditions not triggering animations. (312346@main) (173599629)
Fixed glyph-orientation-vertical: auto to use UTR#50 Vertical Orientation properties for correct character orientation in vertical text. (312008@main) (175064567)
Fixed the SMIL clock value parser to accept hours greater than 99 and reject malformed seconds values. (312350@main) (175593583)
Fixed stroke-dasharray interpolation to use least common multiple for list length matching and corrected composition behavior. (312055@main) (175598175)
Security
Resolved Issues
Fixed Content-Security-Policyobject-src with an empty or invalid source list to block empty <object> and <embed> elements consistently with object-src 'none'. (312899@main) (171298717)
Storage
Resolved Issues
Fixed an issue where IndexedDB could incorrectly return a version 0 database after an abort during the initial onupgradeneeded event. (312535@main) (176195526)
Fixed FileSystemHandle serialization and deserialization when no storage is available. (312616@main) (176267344)
Web API
New Features
Added support for creating dedicated workers inside shared workers per the HTML Standard. (312503@main) (118945089)
Resolved Issues
Fixed the parent window’s history.state being set to null when history.pushState is called from a child iframe. (312475@main) (50019069)
Fixed clicking on a scrollbar of an overflow container blurring the current activeElement. (312924@main) (92367314)
Fixed an issue where an Event object’s target property could lose its JavaScript wrapper due to premature garbage collection. (312017@main) (175439759)
Fixed FileSystemDirectoryHandle.resolve() to return the correct path array for child entries. (312061@main) (175645387)
Fixed PerformanceNavigationTiming.domInteractive and domContentLoadedEventEnd incorrectly returning 0 instead of the correct timestamps. (312500@main) (175739835)
Fixed FileSystemDirectoryHandle.removeEntry() to correctly remove entries. (312193@main) (175745157)
Fixed CryptoKey to correctly remain associated with its secure context. (312502@main) (176157712)
Fixed: Improved cross-origin isolation enforcement for workers. (312518@main) (176175488)
Fixed SharedArrayBuffer cloning and agent cluster ID assignment. (312800@main) (176465817)
Web Extensions
New Features
Added support for propagating user gestures through sendMessage(), connect(), postMessage(), and executeScript() APIs, enabling extensions to perform gesture-requiring actions like media playback. (312463@main) (175797617)
Resolved Issues
Fixed an issue where web extension service worker registration database files accumulated on each Safari launch, causing performance degradation. (312231@main) (175484888)
Web Inspector
Resolved Issues
Fixed an issue where the input field for recording canvas frames in the Graphics tab was sometimes too small to type in and only allowed typing one character at a time. (312433@main) (157787230)
Fixed a regression where RegisterSet::normalizeWidths() lost vector-width information, causing v128 argument corruption in WebAssembly SIMD thunks. (312610@main) (176035764)
WebGL
Resolved Issues
Fixed compressedTexImage not validating whether the compressed texture format extension has been enabled. (312180@main) (175652171)
Fixed some texImage functions reporting errors with incorrect function names. (312156@main) (175652807)
Fixed some WebGL context state properties not being correctly reset on context loss. (312605@main) (176190808)
WebGPU
Resolved Issues
Fixed GPUDevice.onuncapturederror event handler attribute not working. (312043@main) (149577124)
Fixed: Restored maxStorageBuffersInFragmentStage and related WebGPU limits. (312387@main) (160800947)
Update on what happened in WebKit in the week from May 11 to May 18.
For this week we have quite a collection of news! Ranging a variety of improvements
to dialog.requestClose(), rendering fixes, the new Skia-based compositor enabled by
default, and proper versioning and improvements to the WebKit Container SDK, there's
news for everyone.
Cross-Port 🐱
Update the closeWatcher.requestClose() function to no longer require user activation, aligning with the spec.
Implement actually moving the node in the DOM when moveBefore() is called.
Fix handling of nested calls to dialog.requestClose().
Add missing preliminary checks to dialog.requestClose().
Graphics 🖼️
Fixed an issue where background images were unexpectedly stretched, primarily affecting the reCAPTCHA checkmark image.
Added opt-in auto-enter for the WebKit Container SDK - the GTK/WPE wrapper scripts (build-webkit, run-webkit-tests, run-api-tests, etc.) now relaunch themselves inside a pinned wkdev-build podman container when WEBKIT_CONTAINER_SDK_ENABLE_AUTOENTER=1 is set. A new .wkdev-sdk-version file at the repo root pins the SDK image, so the image can be bumped in a PR and validated through EWS. Without the flag, wrappers run on the host exactly as before.
Introduced a proper version scheme for the wkdev-sdk image provided by the WebKit Container SDK so consumers can pin to a known revision. The :latest tag, the WKDEV_SDK_TAG/--tag override and the tag/* branch mechanism are replaced by a single machine-checkable format <major>.<minor>-v<count>-<gitsha> (e.g. 2.53-v1-916f9ef), where <major>.<minor> tracks the WebKitGTK/WPE release cycle, v<count> is the per-cycle SDK build counter, and <gitsha> traces the image back to its source commit. wkdev-create gains a --version switch (full or bare <major>.<minor>). wkdev-update supports updating from latest tag to the new versioning scheme, just run it on your host to update to the latest SDK.
Switched the wkdev-build container from a persistent container to ephemeral podman run --rm --init per invocation. This removes the manual podman rm step necessary whenever container creation arguments changed (which the tooling was not handling by itself), the first-run recursive-chown cost, and the podman start step after host reboots.
Update on what happened in WebKit in the week from May 4 to May 11.
This week we have a bag of exciting updates, such as fixes to crashes, better
YouTube playback, a handful of advancements to WebXR, and the development
releases of WebKitGTK and WPE WebKit 2.53.2.
Cross-Port 🐱
If the filesystem runs out of space while the NetworkProcess is writing into its network cache, the process will crash with SIGBUS. This would surface to users as the "Internal error fired from WebLoaderStrategy.cpp(559) : internallyFailedLoadTimerFired" error, and would be handled by re-spawning another NetworkProcess that would similarly fail.
This was addressed by using fallocate, if available, to reserve the required size. If fallocate fails to reserve, the NetworkProcess will skip caching, avoiding the crash. If fallocate is not available, the existing behaviour is preserved.
Networking 📶
Networking support, including the libsoup HTTP library.
libsoup now supports the zstd compression encoding.
Multimedia 🎥
GStreamer-based multimedia support for WebKit, including (but not limited to) playback, capture, WebAudio, WebCodecs, and WebRTC.
getUserMedia() and getDisplayMedia() support should work better thanks to a couple PipeWire related fixes.
Playback of some YouTube videos (usually at low framerate) has been fixed. Eventually a better solution will involve supporting edit lists in the GStreamer MSE backend.
Graphics 🖼️
A crash when accessing the diagnostics webkit://gpu page was fixed, making sure we handle the case where libGL.so.1 or libOpenGL.so.0 are missing.
Fixed missing glyph before ZWJ/ZWNJ if no font is found for the cluster.
The second unstable releases for the current development cycle have been published: WebKitGTK 2.53.2 and WPE WebKit 2.53.2. Development releases are intended is to gather early feedback on upcoming changes, and as such issue reports are welcome in Bugzilla.
Update on what happened in WebKit in the week from April 8 to April 28.
After a short hiatus, we return with a galore of releases, more Web Platform improvements,
tricky tweaks to thread scheduling, new niceties in the Web Inspector, and new build
options to take advantage of compiler optimizations.
Cross-Port 🐱
Delivered a number of changes that have strengthened WPE WebKit and WebKitGTK's behaviour around real-time thread promotion and demotion:
This means WebKit now has time to gracefully handle SIGXCPU, and will do it in an async-signal-safemanner.
Additionally, the NetworkProcess' Cache Storage thread is now defined as QOS::UserInitiated on Linux, which no longer maps to real-time priority. Its earlier mapping to real-time was previously reported as a NetworkProcess crash in the logs (it was in practice a kernel-delivered SIGKILL, but WebKit doesn't make any distinction while logging). After limits were adjusted, this thread was successfully demoted, and now that the mapping has changed, this is no longer promoted to real-time to begin with.
Finally, logging around portal-related failures has been updated to reduce noise.
Implemented the connectedMoveCallback() for custom elements to react to moveBefore().
Implemented the scaffolding for the moveBefore() DOM function. This is the first step towards implementing the full feature and is currently behind a runtime feature flag.
The Web Inspector now highlights the layout root element by hovering over a Layout event in the “Layout & Rendering” timeline view and reveals it in the element tree by clicking a little “go to” arrow button.
Releases 📦️
WebKitGTK 2.52.2 and WPE WebKit 2.52.2 have been released, which include a number of fixes. In particular, building for some less tested configurations should now be possible, and the WPE port includes fixes for input event handling in the Qt API bindings.
The releases were quickly followed by WebKitGTK 2.52.3 and WPE WebKit 2.52.3, with further fixes including an important patch for crashes in JavaScriptCore on architectures other than x86_64, support for the scrollbar-color CSS property, and a fix for rendering certain emoji glyphs. Additionally, the WPE port also gained a new setting to disable overlay scroll bars and use always-visible ones, fixed focus handling for touch input in the built-in Wayland platform implementation, and a build fix for the Qt one.
In addition to maintenance for the stable branch, the first unstable releases for the current development cycle are also available: WebKitGTK 2.53.1 and WPE WebKit 2.53.1. These are the first published versions that remove the option to use Cairo for 2D rendering—only Skia will be supported going forward. On the additions front, there are graphics subsystem improvements, a few API additions, and initial support in the CMake build system for builds using Profile-Guided Optimization (PGO, needs Clang for now). The goal of development releases is to gather early feedback on upcoming changes, and issue reports are welcome in Bugzilla.
Infrastructure 🏗️
PGO (Profile-Guided Optimization) builds with Clang are now supported by the CMake build system.
Update on what happened in WebKit in the week from March 31 to April 7.
Support for iOS dialog light dismiss, a new API to obtain page icons,
WebKit nightly builds for Epiphany Canary produced by
GNOME GitLab, and more conservative checks for MPEG-4 Audio object types
are all part of this week's edition of the WebKit periodical.
Cross-Port 🐱
A new API to obtain page icons (a.k.a. “favicons”) has been added to the GTK port. The new functionality reuses the recently added WebKitImage class and provides access to multiple page icons at once through the added WebKitImageList type, allowing applications to better choose an icon that suits their needs. Changes to the WebKitWebView.page-icons property are guaranteed to be done once per page load, when all icon images are available to be used. This new API has been also enabled for the WPE port, and the plan is to deprecate the old page favicon functionality going forward.
GStreamer-based multimedia support for WebKit, including (but not limited to) playback, capture, WebAudio, WebCodecs, and WebRTC.
canPlayType() is now more conservative regarding MPEG-4 Audio object types. This primarily affects AAC extensions: In the past, as long as there was an AAC decoder installed, WebKit was accepting any codec string that started with mp4a. Now it only accepts codec strings that correspond to object types that have widespread support. This can prevent accidental playback of newer formats like xHE-AAC, which many decoders don't yet support — for example, as of writing, FFmpeg support for xHE-AAC is only very recent and still incomplete.
The GStreamer WebRTC backend now rejects SDP including rtpmap attributes in the disallowed range of 64-95 payload types. Compliance with RFC 7587 was also improved.
Infrastructure 🏗️
The WebKitGTK nightly builds for Epiphany Canary are now handled entirely by the GNOME GitLab infrastructure, many thanks to them! The previous approach was not optimal, producing release builds without debug symbols. With the new builds, it is now easier to get crash stack traces including more information.
Update on what happened in WebKit in the week from March 23 to March 30.
This week comes with a mixed bag of new features, incremental improvements,
and a new release with the ever important security issue fixes. Also: more
blog posts!
Cross-Port 🐱
Implemented initial support for
closedby=any on dialog elements, which adds light dismiss behaviour. This is
behind the ClosedbyAttributeEnabled feature flag.
Added the remaining values for the
experimental closedby attribute implementation.
MiniBrowser now has a
--profile-dir=DIR command line option that can be used to specify a custom
directory where website data and cache can be stored, to test, for example,
behavior in a clean session.
Multimedia 🎥
GStreamer-based multimedia support for WebKit, including (but not limited to)
playback, capture, WebAudio, WebCodecs, and WebRTC.
Fixed several OpenGL state
restoration bugs in BitmapTexture . These could cause a mismatch between the
GL state assumed by Skia and the actual one, leading to rendering artifacts
with certain GPU drivers and configurations.
The SKIA_DEBUG CMake option has been
enabled for Debug builds, enabling
Skia's internal assertions, debug logging, and consistency checks (e.g. bounds
checking, resource key diagnostics). It remains off by default for Release
and RelWithDebInfo builds, and can still be explicitly configured via
-DSKIA_DEBUG=ON|OFF.
WPE WebKit 📟
WPE Platform API 🧩
New, modern platform API that supersedes usage of libwpe and WPE backends.
The new WPE_SETTING_OVERLAY_SCROLLBARS setting is now
available, and disabling it will use a
more traditional, always visible scrollbar style.
Releases 📦️
A new USE_GSTREAMER build option may now be
used to toggle the features that
require GStreamer at once. This can be used to effectively disable all
multimedia support, which previously needed toggling four CMake options.
WebKitGTK
2.52.1 and
WPE WebKit 2.52.1 have
been released. On top of a small corrections typical of the first point
releases in a new stable series, this one includes a number of fixes for
security issues, and it is a recommended update. The corresponding security
advisory, WSA-2026-0002
(GTK,
WPE) has been published as
well.
Community & Events 🤝
Simón Pena wrote a blog post showing how to create a minimal WPE
launcher,
which uses a Fedora Podman container with pre-built WPE WebKit libraries and a
launcher with barely 10 lines of code to display a web view. This complements
Kate Lee's custom HTML context menu blog
post
from last week.
My colleague Kate recently demonstrated on her blog how simple it is to write a WPE Platform-based launcher, and did so by building it side-by-side with MiniBrowser, inside the WebKit tree.
This entry takes one step back, and demonstrates the same concepts assuming you are not building WPE WebKit yourself, but rather getting it from your distribution. Many of the steps below would apply if you were using a Yocto/OpenEmbedded-based image, but that can be the focus of another post.
Getting WPE WebKit
Get WPE lists a number of options to get WPE from your preferred distribution. At the moment of writing, Fedora, Debian and ArchLinux are your best choices to get a recent version of WPE:
2.52 on Fedora
2.50 on Debian Forky, 2.52 on Debian Sid
2.50 on ArchLinux
However, since WPE Platform hasn’t officially been released, we need to use Fedora, where my colleague Philippe maintains a Copr repository with it enabled.
Kate’s post builds the launcher as part of the WebKit tree using WebKit’s own CMake infrastructure. For a standalone project, we need a self-contained CMakeLists.txt that finds WPE WebKit through pkg-config:
This snippet relies heavily on default behaviours: it will create a default WPE view, with default top levels, with the default display selection behaviour (Wayland), default context, settings…
Again, Kate’s post does a more realistic job at showing how the various pieces are created and connected together.
You can take a look at wpe_display_get_default() in WPEPlatform/wpe/WPEDisplay.cpp to understand how the automatic selection takes place in the absence of an explicit WPE_DISPLAY request.
(In our example, we are only listing Wayland as a CMake dependency. If libwpewebkit was compiled without DRM or headless support, the environment variable approach would not work.)
Next steps
This is all for now. The next entry in the series will cover classic kiosk features: preventing navigation to unwanted sites, controlling whether new windows can be opened, and intercepting requests through policy decisions.
For a more complete example that includes a custom HTML context menu and JavaScript injection, see Kate’s post.
Update on what happened in WebKit in the week from March 10 to March 18.
The big ticket item in this week's update are the 2.52.0 releases, which
include the work from the last six-month development period, and come with
a security advisory. Meanwhile, WPE-Android also gets a release, and a number
of featured blog posts.
WPE WebKit 📟
Last week we added support to WPE
MiniBrowser to load settings from a key file. This extended the existing
--config-file=FILE feature, which previously only loaded WPEPlatform
settings under the [wpe-platform] group. Now the feature uses
webkit_settings_apply_from_key_file()
to load properties such as user-agent or enable-developer-extras
from the [websettings] group as well.
Releases 📦️
WebKitGTK
2.52.0 and
WPE WebKit 2.52.0 are
now available. These include the results of the effort made by the team during
the last six months, including rendering improvements and performance
optimizations, better security for WebRTC, a more complete WebXR
implementation, and a second preview of the WPEPlatform API for the WPE
port—among many other changes.
Accompanying these releases there is security advisory WSA-2026-0001
(GTK,
WPE), with information
about solved security issues. As usual, we encourage everybody to use the most
recent versions where such issues are known to be fixed.
WPE Android 0.3.3 has been released, and prebuilt packages are available at the Maven Central repository. This is a maintenance release which updates the included WPE WebKit version to 2.50.6 and libsoup to 3.6.6, both of which include security fixes.
Community & Events 🤝
Kate Lee wrote a very interesting blog
post
showing how to create a small application using the WPEPlatform API to
demonstrate one of its newly available features: the Context Menu API. It is
rendered entirely as an HTML overlay, enabling richer and more portable context
menu implementations.
WebXR support for WebKitGTK and WPE has been reworked and aligned with the
modern multi-process architecture, using OpenXR to enable XR device integration
on Linux and Android. Sergio Villar wrote a blog post that explains all the
work done in the
last months around it.